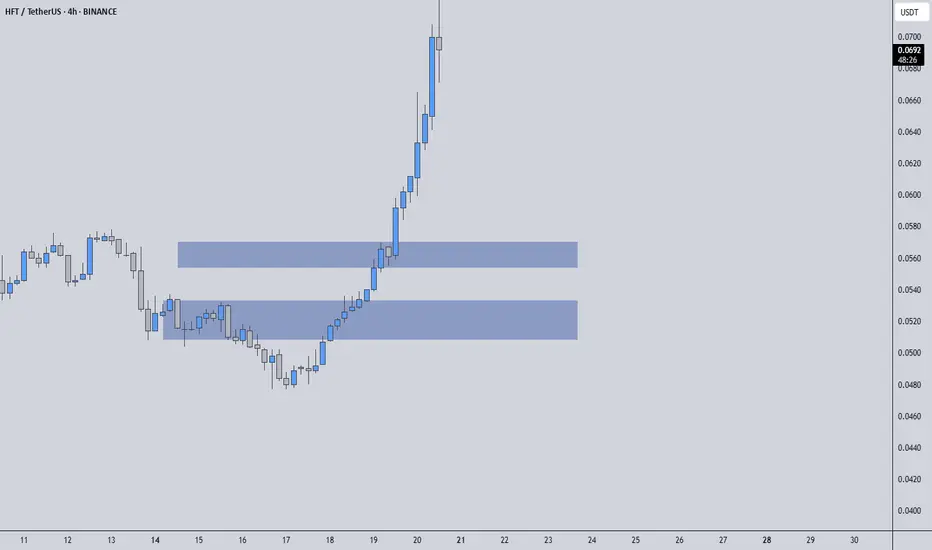
HFTUSDT has exploded in volume today, surging nearly 380% as smart money piled in. When you spot a move like this, it demands attention—but winning traders wait for structure, not hype.
🔵 Why the Blue Boxes Matter
Key Support Zones: The blue boxes mark areas where buyers have historically stepped in. If price dips back into these zones and holds, it often leads to meaningful bounces.
Buyer Commitment: Given today’s massive volume spike, those support levels carry extra weight. You want to see price respect these areas before considering longs.
🎯 Trading the Setup
Enter on Confirmation
• Wait for a touch of the blue box, then watch for a clean higher‑low on a lower timeframe (5m–15m).
• Look for CDV supporting the move—if cumulative delta volume confirms buyers are in control, that’s your green light.
Adapt if It Fails
• I will not insist on a bullish bias if HFTUSDT breaks below these boxes without giving a clean upward break in the low time frame—I won’t even evaluate longs.
• If price instead breaks above with volume and retests the blue box as support, I’ll shift in and target the next resistance.
Smart Risk Management
• Place your stop just below the blue box. If it doesn’t hold, you exit quickly.
• This isn’t about holding forever—capture the reaction, lock in gains, and let the market breathe.
💬 Why You Can Trust This Analysis
I share only the highest‑probability setups, backed by a track record you can verify on my profile. Most traders miss these clear signals; they chase noise while we trade with precision. When volume spikes + structure aligns, opportunity knocks—make sure you’re ready to answer.
📌I keep my charts clean and simple because I believe clarity leads to better decisions.
📌My approach is built on years of experience and a solid track record. I don’t claim to know it all but I’m confident in my ability to spot high-probability setups.
📌If you would like to learn how to use the heatmap, cumulative volume delta and volume footprint techniques that I use below to determine very accurate demand regions, you can send me a private message. I help anyone who wants it completely free of charge.
🔑I have a long list of my proven technique below:
I stopped adding to the list because it's kinda tiring to add 5-10 charts in every move but you can check my profile and see that it goes on..
🔵 Why the Blue Boxes Matter
Key Support Zones: The blue boxes mark areas where buyers have historically stepped in. If price dips back into these zones and holds, it often leads to meaningful bounces.
Buyer Commitment: Given today’s massive volume spike, those support levels carry extra weight. You want to see price respect these areas before considering longs.
🎯 Trading the Setup
Enter on Confirmation
• Wait for a touch of the blue box, then watch for a clean higher‑low on a lower timeframe (5m–15m).
• Look for CDV supporting the move—if cumulative delta volume confirms buyers are in control, that’s your green light.
Adapt if It Fails
• I will not insist on a bullish bias if HFTUSDT breaks below these boxes without giving a clean upward break in the low time frame—I won’t even evaluate longs.
• If price instead breaks above with volume and retests the blue box as support, I’ll shift in and target the next resistance.
Smart Risk Management
• Place your stop just below the blue box. If it doesn’t hold, you exit quickly.
• This isn’t about holding forever—capture the reaction, lock in gains, and let the market breathe.
💬 Why You Can Trust This Analysis
I share only the highest‑probability setups, backed by a track record you can verify on my profile. Most traders miss these clear signals; they chase noise while we trade with precision. When volume spikes + structure aligns, opportunity knocks—make sure you’re ready to answer.
📌I keep my charts clean and simple because I believe clarity leads to better decisions.
📌My approach is built on years of experience and a solid track record. I don’t claim to know it all but I’m confident in my ability to spot high-probability setups.
📌If you would like to learn how to use the heatmap, cumulative volume delta and volume footprint techniques that I use below to determine very accurate demand regions, you can send me a private message. I help anyone who wants it completely free of charge.
🔑I have a long list of my proven technique below:
- 🎯 ZENUSDT.P: Patience & Profitability | %230 Reaction from the Sniper Entry
- 🐶 DOGEUSDT.P: Next Move
- 🎨 RENDERUSDT.P: Opportunity of the Month
- 💎 ETHUSDT.P: Where to Retrace
- 🟢 BNBUSDT.P: Potential Surge
- 📊 BTC Dominance: Reaction Zone
- 🌊 WAVESUSDT.P: Demand Zone Potential
- 🟣 UNIUSDT.P: Long-Term Trade
- 🔵 XRPUSDT.P: Entry Zones
- 🔗 LINKUSDT.P: Follow The River
- 📈 BTCUSDT.P: Two Key Demand Zones
- 🟩 POLUSDT: Bullish Momentum
- 🌟 PENDLEUSDT.P: Where Opportunity Meets Precision
- 🔥 BTCUSDT.P: Liquidation of Highly Leveraged Longs
- 🌊 SOLUSDT.P: SOL's Dip - Your Opportunity
- 🐸 1000PEPEUSDT.P: Prime Bounce Zone Unlocked
- 🚀 ETHUSDT.P: Set to Explode - Don't Miss This Game Changer
- 🤖 IQUSDT: Smart Plan
- ⚡️ PONDUSDT: A Trade Not Taken Is Better Than a Losing One
- 💼 STMXUSDT: 2 Buying Areas
- 🐢 TURBOUSDT: Buy Zones and Buyer Presence
- 🌍 ICPUSDT.P: Massive Upside Potential | Check the Trade Update For Seeing Results
- 🟠 IDEXUSDT: Spot Buy Area | %26 Profit if You Trade with MSB
- 📌 USUALUSDT: Buyers Are Active + %70 Profit in Total
- 🌟 FORTHUSDT: Sniper Entry +%26 Reaction
- 🐳 QKCUSDT: Sniper Entry +%57 Reaction
- 📊 BTC.D: Retest of Key Area Highly Likely
- 📊 XNOUSDT %80 Reaction with a Simple Blue Box!
- 📊 BELUSDT Amazing %120 Reaction!
I stopped adding to the list because it's kinda tiring to add 5-10 charts in every move but you can check my profile and see that it goes on..
Professional Day Trader
Microstructure Practicioner
t.me/umuttrades
kick.com/umuttrades live everyday.
Microstructure Practicioner
t.me/umuttrades
kick.com/umuttrades live everyday.
Related publications
Disclaimer
The information and publications are not meant to be, and do not constitute, financial, investment, trading, or other types of advice or recommendations supplied or endorsed by TradingView. Read more in the Terms of Use.