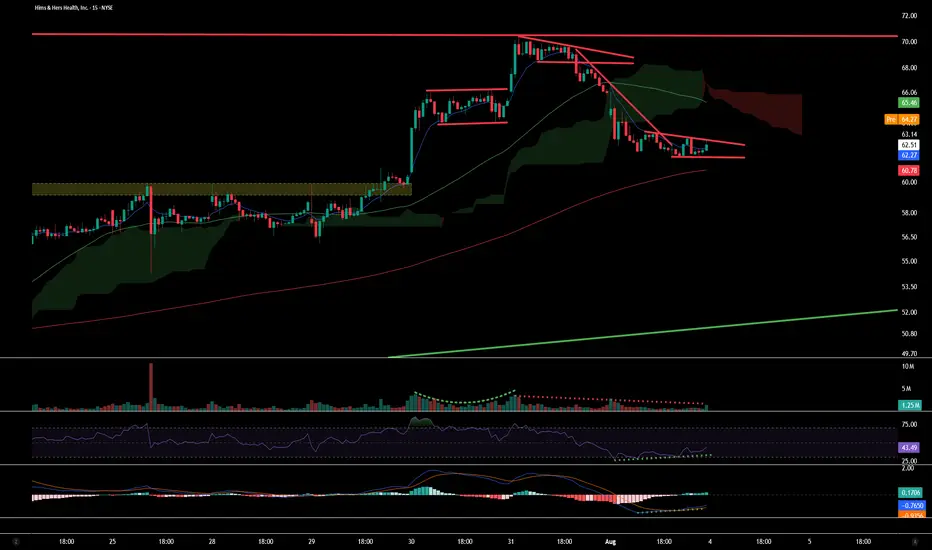
On the 15m Chart, you can see a bull flag and pennant form which broke down with confluence from MACD and RSI showing downside pressure. forming a bear pennant. However, both indicators are now flashing bullish divergence — price action is printing lower lows, while RSI and MACD are printing higher lows.
Premarket has broken above above the pennant, confirming the divergence.
Disclaimer
The information and publications are not meant to be, and do not constitute, financial, investment, trading, or other types of advice or recommendations supplied or endorsed by TradingView. Read more in the Terms of Use.
Disclaimer
The information and publications are not meant to be, and do not constitute, financial, investment, trading, or other types of advice or recommendations supplied or endorsed by TradingView. Read more in the Terms of Use.