🔻 📉
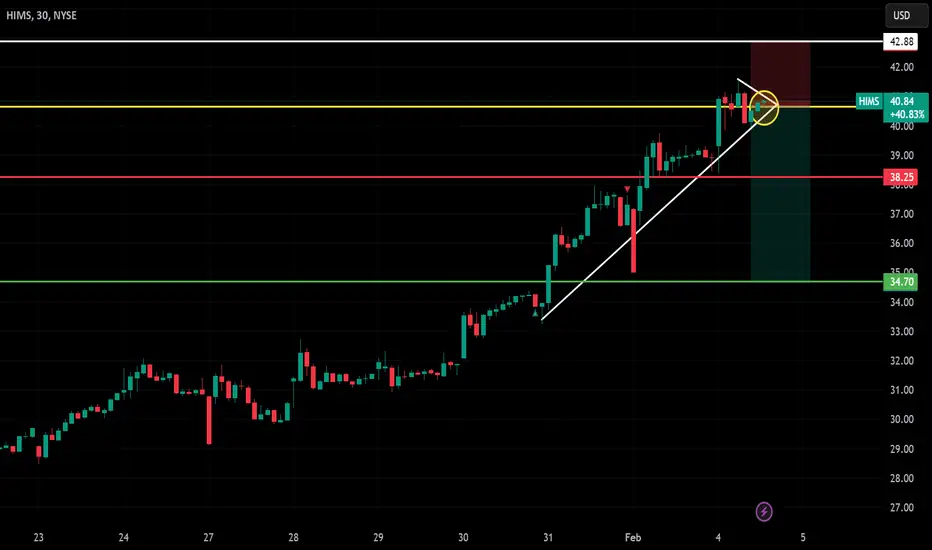
🔍 Stock: HIMS (NYSE)
⏳ Timeframe: 30-Min Chart
📉 Setup Type: Bearish Breakdown
📍 Trade Plan:
✅ Entry Zone: Below $40.66 (Breakdown confirmation from ascending support)
🚀 Take Profit 1 (TP1): $38.25 (First Key Support)
🚀 Take Profit 2 (TP2): $34.70 (Extended Target if selling pressure continues)
🔻 Stop-Loss (SL): $42.88 (Above resistance to limit risk)
📊 Risk-Reward Ratio: Favorable for a bearish continuation 📉📈
🔹 Technical Analysis & Setup:
✅ Pattern: Rising Wedge Breakdown 📈 → 📉
✅ Resistance Zone: Strong seller presence around $40.66 - $42.88
✅ Breakdown Confirmation Needed: Price should drop below $40.66 with strong volume
✅ Momentum Shift Expected: Breakdown signals a potential downtrend
🔥 Trade Strategy & Refinements:
📊 Volume Confirmation: Look for increased selling volume below $40.66 📉
📉 Trailing Stop Strategy: Once price reaches TP1 ($38.25), adjust SL lower to secure profits
💰 Partial Profit Booking: Take partial profits at $38.25 and let the rest ride toward $34.70+
⚠️ Watch for Fake Breakdowns: If price rises back above $41.50, reconsider the setup
🚀 Final Thoughts:
✅ Bearish Breakdown Expected – High probability of continuation lower 📉
✅ Strong Resistance at $40.66 - $42.88 – Ideal short entry for risk-reward optimization 💰
✅ Momentum Shift Possible – A drop below $38.25 could accelerate downside move 🚀
📊 Trade Smart & Stick to Your Plan! 🏆🔥
🔗 #ShortTrade #StockTrading #HIMS #TechnicalAnalysis #DayTrading #MomentumTrading #BearishBreakdown #RiskReward #TradingPlan #ProfittoPath 🚀📉
Disclaimer
The information and publications are not meant to be, and do not constitute, financial, investment, trading, or other types of advice or recommendations supplied or endorsed by TradingView. Read more in the Terms of Use.
Disclaimer
The information and publications are not meant to be, and do not constitute, financial, investment, trading, or other types of advice or recommendations supplied or endorsed by TradingView. Read more in the Terms of Use.