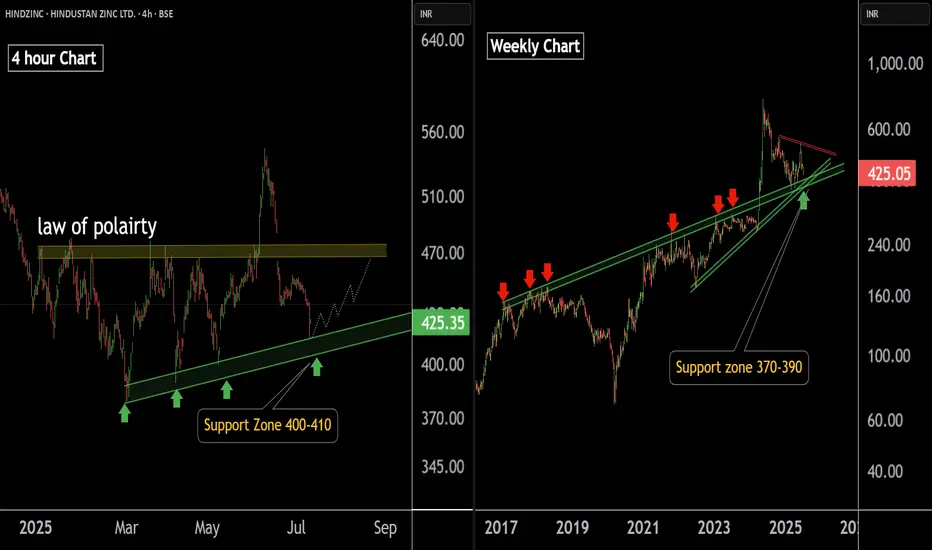
There are two charts of Hindustan Zinc — one on the 4-hour time frame, and the second on weekly time frame.
Chart 1 (4-Hour Timeframe):
The stock is moving in a Higher High, Higher Low (HH-HL) structure, indicating a bullish trend.
Support zone is observed near the 400–410 range.
Chart 2 (Weekly Timeframe):
On the weekly chart:
the stock is approaching a major support zone in the range of ₹375 – ₹390, which has historically held strong.
If this level is sustain then we may see higher prices in HINDZINC.
Thank You !!
@RahulSaraoge
Connect us at t.me/stridesadvisory
Connect us at t.me/stridesadvisory
Disclaimer
The information and publications are not meant to be, and do not constitute, financial, investment, trading, or other types of advice or recommendations supplied or endorsed by TradingView. Read more in the Terms of Use.