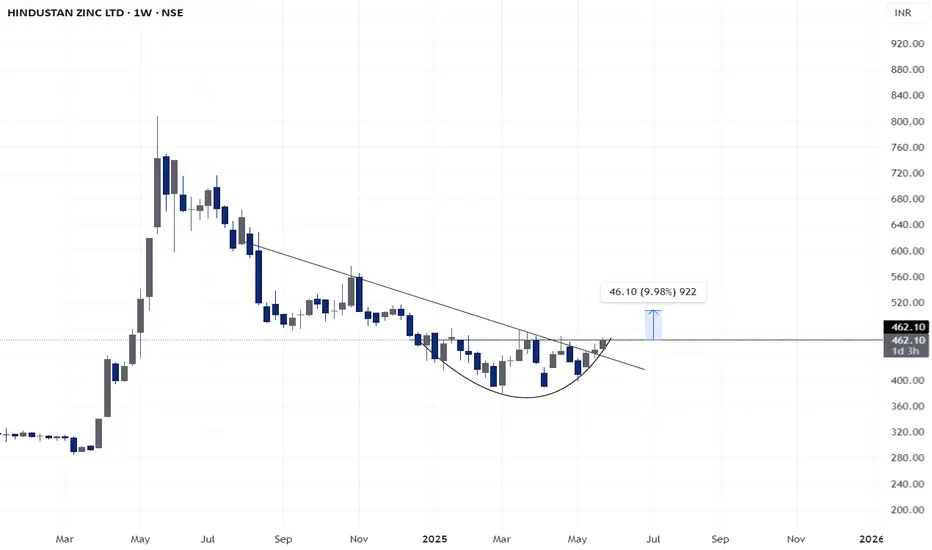
The chart of Hindustan Zinc Ltd shows a bullish cup breakout on the weekly timeframe. The price has:
Broken above a long-term downtrend line
Cleared key resistance at ₹460
Formed a strong bullish candle, signaling buying interest
This suggests a trend reversal with an upside target of around ₹610, while a close below ₹420 would invalidate the setup
Broken above a long-term downtrend line
Cleared key resistance at ₹460
Formed a strong bullish candle, signaling buying interest
This suggests a trend reversal with an upside target of around ₹610, while a close below ₹420 would invalidate the setup
Disclaimer
The information and publications are not meant to be, and do not constitute, financial, investment, trading, or other types of advice or recommendations supplied or endorsed by TradingView. Read more in the Terms of Use.
Disclaimer
The information and publications are not meant to be, and do not constitute, financial, investment, trading, or other types of advice or recommendations supplied or endorsed by TradingView. Read more in the Terms of Use.