🆓Helium (HNT) Aug-5 #HNT $HNT
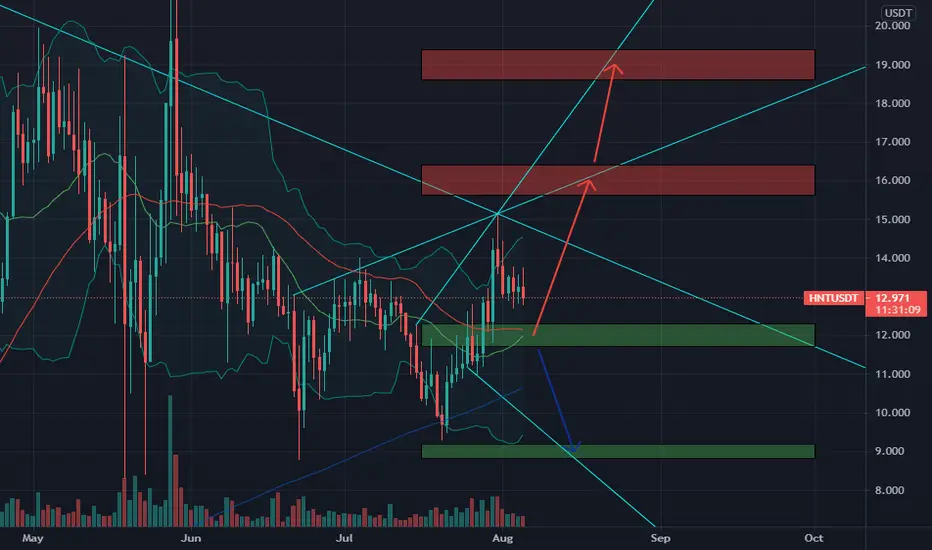
HNT is correcting to the $12 zone before starting to rally strongly to the $16 and $19 zones this August. But if it loses this $12 zone, it will be a very bad sign for HNT as it may fall sharply to $9 or even deeper.
📈BUY
🔴Buy : 11.7-12.3$. SL if B
📉SELL
🔴Sell : 15.6-16.4$. SL if A
🔴Sell : 18.6-19.4$. SL if A
♻️BACK-UP
🔵Sell : 11.7-12.3$ if B. SL if A
🔵Buy : 8.8-9.2$ if A. SL if B
❓Details
🕯Timeframe : 1 Day
📈Red Arrow : Main Direction as BUY and SELL section
📉Blue Arrow : Back-Up Direction as BACK-UP section
🟩Green zone : Support zone as BUY section
🟥Red zone : Resistance zone as SELL section
🅰️A : The Close price of candlestick is Above the zone
🅱️B : The Close price of candlestick is Below the zone
Disclaimer
The information and publications are not meant to be, and do not constitute, financial, investment, trading, or other types of advice or recommendations supplied or endorsed by TradingView. Read more in the Terms of Use.
Disclaimer
The information and publications are not meant to be, and do not constitute, financial, investment, trading, or other types of advice or recommendations supplied or endorsed by TradingView. Read more in the Terms of Use.