If HOOD holds above $70, momentum can carry it to $84–85 in the short term, and as high as $95 if the rally becomes euphoric — but any breakdown below $70 likely resets the move.
1. Price Action – Clean Breakout
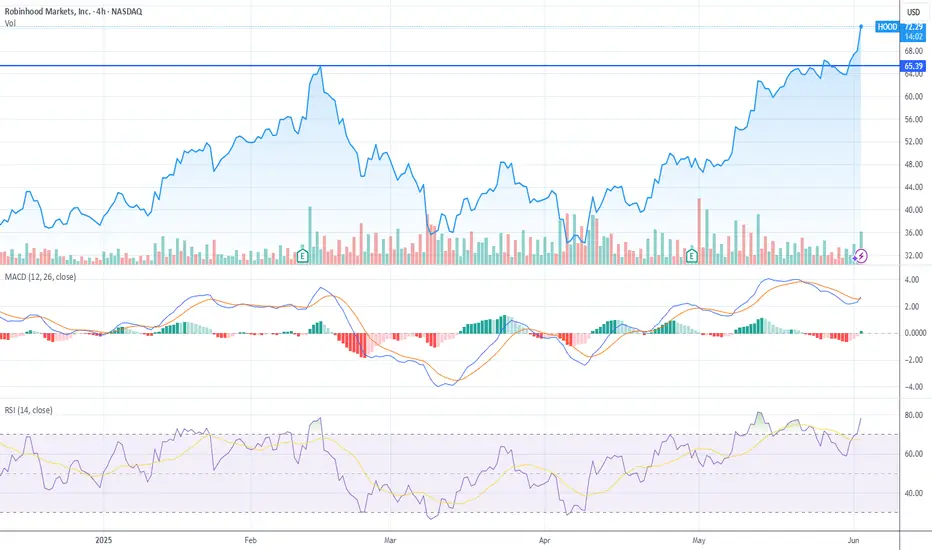
Price surged above a major resistance level around $65.39, which had previously capped price in late March. The breakout candle is strong, impulsive, and supported by volume, suggesting institutional follow-through.
2. RSI – Overbought Territory
RSI is 78.06, a red flag for short-term exhaustion. While strong trends can keep RSI over 70 for extended periods, moves like this often lead to:
Sideways digestion
Quick shakeouts
Potential for bearish divergence if price pushes higher but RSI rolls over
3. MACD – Elevated and Peaking
MACD lines are still bullishly stacked, but the histogram is flattening. We may be nearing a momentum apex — any softness in price could trigger a MACD rollover, especially on this lower timeframe.
4. Volume – Legitimate Strength
Volume on this breakout is clearly elevated, which confirms this is not a false move — at least not yet. Buyers are showing up, and that raises the bar for sellers to reclaim control.
Summary: Breakout Confirmed, But Cooling Risk Rising
HOOD has launched through resistance with conviction, but both RSI and MACD suggest this leg may be nearing exhaustion — watch for follow-through or failure in the next two sessions.
Where can this go?
Fibonacci Extension (From March Low to May High)
Using:
Swing low (March): ~$35
Swing high (May): ~$65.39
Pullback low (May 23rd): ~$60
Fib Extensions from this leg:
1.0x = $65.39 (already cleared)
1.618 = ~$84.27
2.0 = ~$95.39
That gives us a confluence zone at:
$84–85 (1.618 Fib + Measured Move)
$95–96 (2.0 Fib — extended run)
Bullish on this one
1. Price Action – Clean Breakout
Price surged above a major resistance level around $65.39, which had previously capped price in late March. The breakout candle is strong, impulsive, and supported by volume, suggesting institutional follow-through.
2. RSI – Overbought Territory
RSI is 78.06, a red flag for short-term exhaustion. While strong trends can keep RSI over 70 for extended periods, moves like this often lead to:
Sideways digestion
Quick shakeouts
Potential for bearish divergence if price pushes higher but RSI rolls over
3. MACD – Elevated and Peaking
MACD lines are still bullishly stacked, but the histogram is flattening. We may be nearing a momentum apex — any softness in price could trigger a MACD rollover, especially on this lower timeframe.
4. Volume – Legitimate Strength
Volume on this breakout is clearly elevated, which confirms this is not a false move — at least not yet. Buyers are showing up, and that raises the bar for sellers to reclaim control.
Summary: Breakout Confirmed, But Cooling Risk Rising
HOOD has launched through resistance with conviction, but both RSI and MACD suggest this leg may be nearing exhaustion — watch for follow-through or failure in the next two sessions.
Where can this go?
Fibonacci Extension (From March Low to May High)
Using:
Swing low (March): ~$35
Swing high (May): ~$65.39
Pullback low (May 23rd): ~$60
Fib Extensions from this leg:
1.0x = $65.39 (already cleared)
1.618 = ~$84.27
2.0 = ~$95.39
That gives us a confluence zone at:
$84–85 (1.618 Fib + Measured Move)
$95–96 (2.0 Fib — extended run)
Bullish on this one
Disclaimer
The information and publications are not meant to be, and do not constitute, financial, investment, trading, or other types of advice or recommendations supplied or endorsed by TradingView. Read more in the Terms of Use.
Disclaimer
The information and publications are not meant to be, and do not constitute, financial, investment, trading, or other types of advice or recommendations supplied or endorsed by TradingView. Read more in the Terms of Use.