📈
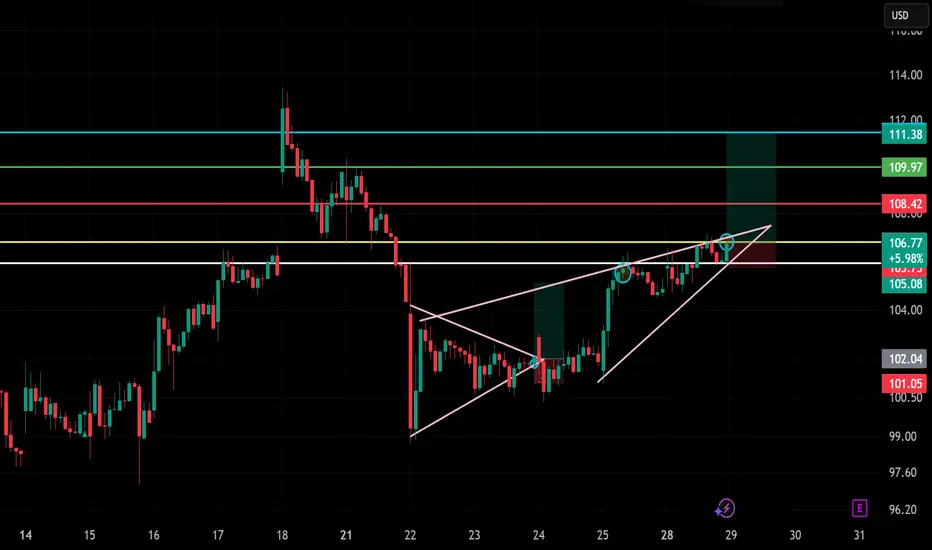
🕰️ Timeframe: 30-minute chart
🔍 Pattern: Ascending wedge breakout
📉 Previous Trend: Bullish continuation from bottom
🧭 Setup: Breakout retest and continuation toward resistance zone
🧩 Technical Breakdown:
Breakout Zone:
Wedge breakout confirmed around $106.00–106.50
Current price near $106.77, retesting breakout (bullish)
Support Zone:
$105.00–105.50 (yellow zone and wedge bottom)
Resistance / Target Zones:
TP1: $108.42 (red zone — recent rejection area)
TP2: $109.97 (green zone — supply)
TP3: $111.38 (cyan line — extended target)
Stop Loss:
Below $104.50–105.00, just under wedge base or yellow zone
Risk-Reward Estimate:
~1:2 to 1:3 R:R, depending on entry near $106 and target at $109–111
⚠️ Key Watchpoints:
Price holding above breakout line and yellow support zone
Momentum volume increasing (not shown in image, but essential)
Clean move past $108.50 can unlock $111
✅ Summary:
HOOD is setting up a momentum continuation play from an ascending wedge breakout. If the price sustains above $106, it has room to run toward the $109–$111 zone. Solid bullish structure with breakout + retest = high-probability long.
Disclaimer
The information and publications are not meant to be, and do not constitute, financial, investment, trading, or other types of advice or recommendations supplied or endorsed by TradingView. Read more in the Terms of Use.
Disclaimer
The information and publications are not meant to be, and do not constitute, financial, investment, trading, or other types of advice or recommendations supplied or endorsed by TradingView. Read more in the Terms of Use.