🔍 Chart Overview
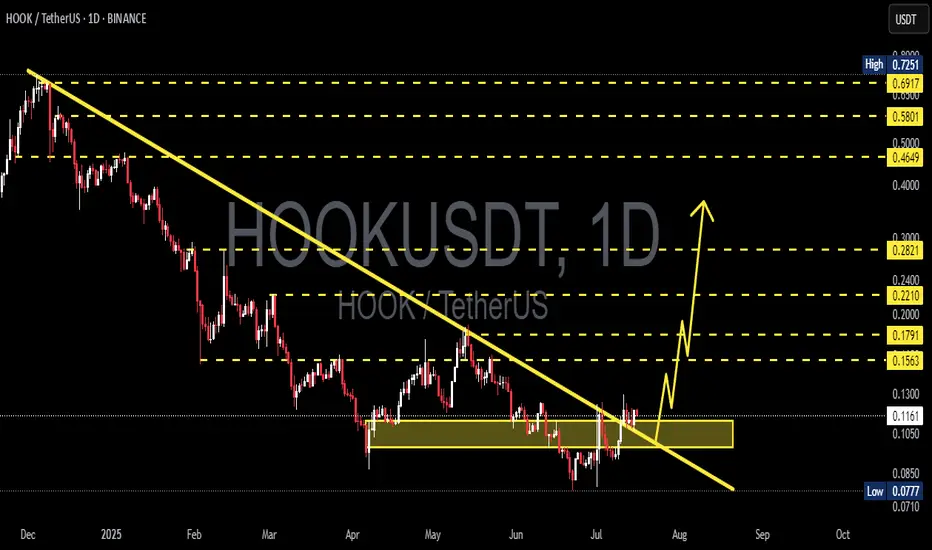
HOOK/USDT has finally broken out of its macro downtrend, which had been holding the price down since December 2024. This breakout is not just a technical move — it could mark the beginning of a mid- to long-term reversal. The price is now retesting the breakout area (yellow box), offering an ideal entry point before a potential rally.
📈 Pattern & Technical Structure
🟡 1. Breakout from Long-Term Downtrend
The yellow trendline shows a 7-month-long bearish trendline.
Price has now closed daily candles above this line, indicating a clear shift in market structure.
The breakout occurred after a sideways accumulation phase between $0.1050 – $0.1200, which also acts as a demand zone.
🟢 2. Inverse Head and Shoulders (IH&S) Pattern
Left and right shoulders formed around $0.1050
Head formed at the $0.0710 – $0.0777 zone
Price has broken above the neckline, validating the IH&S reversal pattern
📊 3. Volume & Momentum
Increased volume during the breakout confirms strong buying interest
If the retest holds, bullish momentum could accelerate toward key resistance levels
🟢 Bullish Scenario (Positive Outlook)
If price holds above the retest zone ($0.1167 – $0.1200) and confirms support:
Bullish Targets:
1. $0.1300 – Nearest minor resistance
2. $0.1563 – Breakout confirmation zone
3. $0.1791 – Psychological and fib confluence
4. $0.2210 – IH&S pattern target
5. $0.2821 – Key horizontal resistance
6. $0.4649 – $0.5801 – Golden pocket zone (Fibonacci retracement)
✅ Potential ROI: 100%+ from current levels
🔴 Bearish Scenario (Negative Outlook)
If HOOK fails to hold above $0.1050:
The breakout may become a false breakout (bull trap)
Price could fall back toward $0.0850
A deeper drop toward $0.0777 – $0.0710, the last major demand zone
🚫 Breakdown below this zone would re-enter a long consolidation phase
🎯 Conclusion & Strategy
HOOK is at a critical turning point. A confirmed breakout from the macro downtrend + IH&S pattern signals a high-probability bullish reversal. The current pullback serves as a textbook retest — a prime area for entries.
Aggressive traders can consider entering now with SL below $0.1050. Conservative traders may wait for confirmation candles above $0.1300.
✅ Quick Checklist:
✅ Confirmed breakout from macro downtrend
✅ Inverse Head and Shoulders pattern active
✅ Volume spike supports breakout
✅ Retest in progress at key demand zone
#HOOKUSDT #HookBreakout #CryptoReversal #AltcoinSeason #InverseHeadAndShoulders #TechnicalBreakout #CryptoAnalysis #ChartPattern #TradingSignals #HookAnalysis #BreakoutCrypto
✅ Get Free Signals! Join Our Telegram Channel Here: t.me/TheCryptoNuclear
✅ Twitter: twitter.com/crypto_nuclear
✅ Join Bybit : partner.bybit.com/b/nuclearvip
✅ Benefits : Lifetime Trading Fee Discount -50%
✅ Twitter: twitter.com/crypto_nuclear
✅ Join Bybit : partner.bybit.com/b/nuclearvip
✅ Benefits : Lifetime Trading Fee Discount -50%
Disclaimer
The information and publications are not meant to be, and do not constitute, financial, investment, trading, or other types of advice or recommendations supplied or endorsed by TradingView. Read more in the Terms of Use.