Long
HOTBTC: Weekly Flirting With TD Green Price Flip
To elaborate on the Daily bullish view of HOT/BTC:
Bullish divergence aside, I'm liking the simplistic sequential weekly view at the moment:
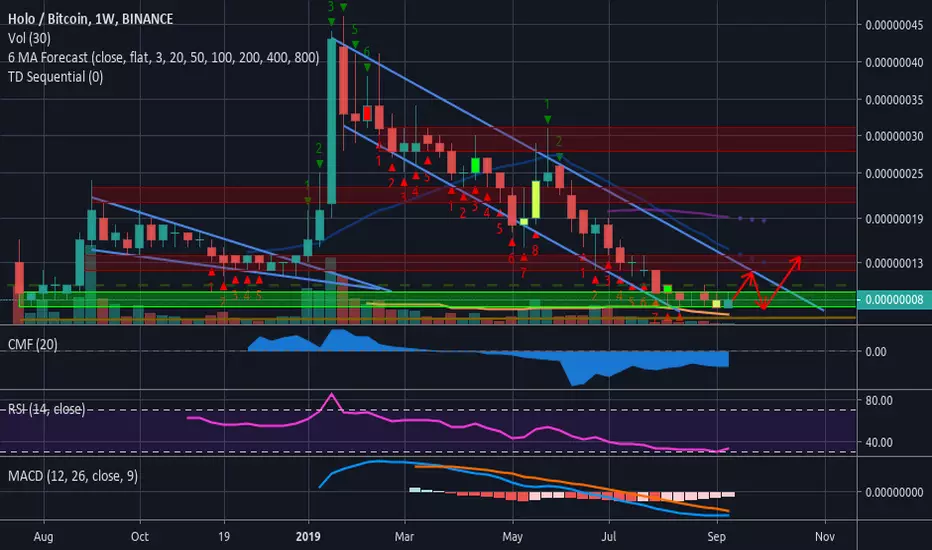
Resistance levels modified for weekly view: 12-14, 21-23, 28-31 as well as 46 ATH.
HODL for dear life?
- Bullish divergence on the CMF (compared to bearish on the Daily time frame).
- RSI beginning to find support from breaching oversold conditions at 30.
- TD Sequential reached an aggressive 13 (as far as TV algo goes).
- Weekly candle is flirting with a green 1 when 9 sats or above.
- MACD yet to bull cross but coming closer together.
Bullish divergence aside, I'm liking the simplistic sequential weekly view at the moment:
- The last time a green 2 went above a green 1 was in January 2019, the price rose 20 sats to 46 ATH within 2 weeks.
- The price therefore could breach the falling channel resistance first time (on a green 3 going above a 2).
- Next week could active the first long trade on HOTBTC for 9 months, based on the sequential system.
Resistance levels modified for weekly view: 12-14, 21-23, 28-31 as well as 46 ATH.
HODL for dear life?
Note
This is totally still holding up despite the sell off :-)Note
Going exactly as planned, Green 2 going above the Green 1 on a Weekly timeframe.Currently testing channel resistance.
Trade active
Note
Break even stop loss @ 10 sats. Currently facing resistance.Related publications
Disclaimer
The information and publications are not meant to be, and do not constitute, financial, investment, trading, or other types of advice or recommendations supplied or endorsed by TradingView. Read more in the Terms of Use.
Related publications
Disclaimer
The information and publications are not meant to be, and do not constitute, financial, investment, trading, or other types of advice or recommendations supplied or endorsed by TradingView. Read more in the Terms of Use.