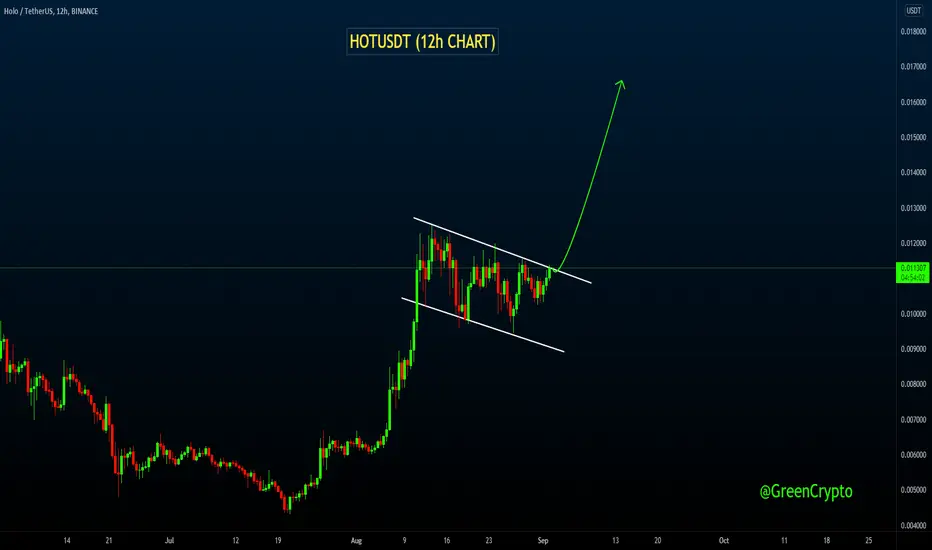
HOTUSDT (12h CHART) Technical Analysis
Flag Pattern
HOT/USDT (12h CHART) currently trading at $0.0112
Buy-level: Above $0.0113
Stop loss: Below $0.0096
Target 1: $0.0122
Target 2: $0.0130
Target 3: $0.0145
Target 4: $0.0166
Max Leverage: 2X
ALWAYS KEEP STOP LOSS...
Follow Our Tradingview Account for More Technical Analysis Updates, | Like, Share and Comment Your thoughts.
📢 Telegram Channel: t.me/getgreencrypto
🆓 Free Trial / Contact Us: t.me/greencryptosupport
🌐 Website: greencrypto.net
📚 Docs: docs.greencrypto.net
🆓 Free Trial / Contact Us: t.me/greencryptosupport
🌐 Website: greencrypto.net
📚 Docs: docs.greencrypto.net
Disclaimer
The information and publications are not meant to be, and do not constitute, financial, investment, trading, or other types of advice or recommendations supplied or endorsed by TradingView. Read more in the Terms of Use.