Technical Analysis by Blaž Fabjan
Ascending Channel:
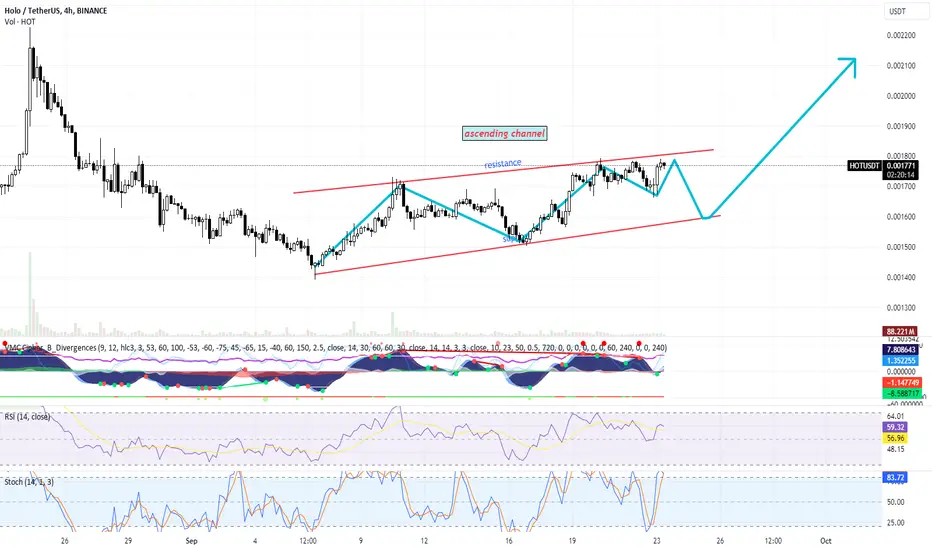
The price is moving inside an ascending channel with clear resistance and support lines. This channel is characterized by higher highs and higher lows, indicating an upward trend.
The price has previously bounced off the support line multiple times, confirming the validity of the ascending channel.
The price action is approaching the upper resistance line of the channel, which could act as a barrier for further upward movement unless broken.
Potential Scenario:
The chart suggests a pullback after testing the resistance, with the potential for the price to drop back to the support line of the ascending channel before resuming its upward momentum.
The upward arrow drawn on the chart indicates an expectation of a bullish continuation after the pullback.
RSI (Relative Strength Index):
The RSI indicator currently sits around 58, which is in the neutral zone, not showing overbought or oversold conditions. This suggests that there is still room for the price to move in either direction.
A possible future rise in the RSI towards overbought levels (above 70) would align with the forecasted bullish move.
Stochastic RSI:
The Stochastic RSI is above 80, indicating that the asset is in overbought territory. This supports the idea of a short-term pullback before another upward move.
Once the Stochastic RSI cools down and approaches oversold levels, it could signal a better entry point for a long position.
MACD (Moving Average Convergence Divergence):
The MACD is slightly bullish with some divergence, showing that momentum is in favor of buyers, but it's not very strong.
A potential bullish cross of the MACD signal lines could confirm further upside momentum.
Volume:
The volume seems relatively stable, although not significantly high. Higher volume on a breakout above the resistance line would confirm a stronger bullish trend.
Trading Plan:
Entry Point:
Wait for a pullback towards the support line of the ascending channel (around $0.00165 - $0.00160), which could provide a better entry point for a long position.
Confirm entry with a bounce off the support line, or when indicators such as the RSI or Stochastic RSI reach oversold conditions.
Stop Loss:
Place a stop loss below the support line of the channel, at approximately $0.00155, to limit losses in case of a breakdown below the channel.
Target:
First target: Resistance of the ascending channel (around $0.00180 - $0.00185). This aligns with the previous highs, offering a solid take-profit level.
Second target: If the price breaks above the resistance line with strong volume, the next target would be around $0.0020 or higher, following the bullish projection shown by the arrow in the chart.
Risk Management:
Ensure the risk-to-reward ratio is favorable, aiming for at least 1:2. For example, if risking 5% (stop loss at $0.00155), the first target should yield at least a 10% gain.
Confirmation:
Before taking any position, look for confirmation through price action, such as bullish candlestick patterns (e.g., bullish engulfing) or strong buy volume when the price touches the support line.
This trading plan outlines a potential setup based on the chart. However, always remember to adapt based on real-time market conditions and further confirmations from your indicators.
Ascending Channel:
The price is moving inside an ascending channel with clear resistance and support lines. This channel is characterized by higher highs and higher lows, indicating an upward trend.
The price has previously bounced off the support line multiple times, confirming the validity of the ascending channel.
The price action is approaching the upper resistance line of the channel, which could act as a barrier for further upward movement unless broken.
Potential Scenario:
The chart suggests a pullback after testing the resistance, with the potential for the price to drop back to the support line of the ascending channel before resuming its upward momentum.
The upward arrow drawn on the chart indicates an expectation of a bullish continuation after the pullback.
RSI (Relative Strength Index):
The RSI indicator currently sits around 58, which is in the neutral zone, not showing overbought or oversold conditions. This suggests that there is still room for the price to move in either direction.
A possible future rise in the RSI towards overbought levels (above 70) would align with the forecasted bullish move.
Stochastic RSI:
The Stochastic RSI is above 80, indicating that the asset is in overbought territory. This supports the idea of a short-term pullback before another upward move.
Once the Stochastic RSI cools down and approaches oversold levels, it could signal a better entry point for a long position.
MACD (Moving Average Convergence Divergence):
The MACD is slightly bullish with some divergence, showing that momentum is in favor of buyers, but it's not very strong.
A potential bullish cross of the MACD signal lines could confirm further upside momentum.
Volume:
The volume seems relatively stable, although not significantly high. Higher volume on a breakout above the resistance line would confirm a stronger bullish trend.
Trading Plan:
Entry Point:
Wait for a pullback towards the support line of the ascending channel (around $0.00165 - $0.00160), which could provide a better entry point for a long position.
Confirm entry with a bounce off the support line, or when indicators such as the RSI or Stochastic RSI reach oversold conditions.
Stop Loss:
Place a stop loss below the support line of the channel, at approximately $0.00155, to limit losses in case of a breakdown below the channel.
Target:
First target: Resistance of the ascending channel (around $0.00180 - $0.00185). This aligns with the previous highs, offering a solid take-profit level.
Second target: If the price breaks above the resistance line with strong volume, the next target would be around $0.0020 or higher, following the bullish projection shown by the arrow in the chart.
Risk Management:
Ensure the risk-to-reward ratio is favorable, aiming for at least 1:2. For example, if risking 5% (stop loss at $0.00155), the first target should yield at least a 10% gain.
Confirmation:
Before taking any position, look for confirmation through price action, such as bullish candlestick patterns (e.g., bullish engulfing) or strong buy volume when the price touches the support line.
This trading plan outlines a potential setup based on the chart. However, always remember to adapt based on real-time market conditions and further confirmations from your indicators.
Disclaimer
The information and publications are not meant to be, and do not constitute, financial, investment, trading, or other types of advice or recommendations supplied or endorsed by TradingView. Read more in the Terms of Use.
Disclaimer
The information and publications are not meant to be, and do not constitute, financial, investment, trading, or other types of advice or recommendations supplied or endorsed by TradingView. Read more in the Terms of Use.