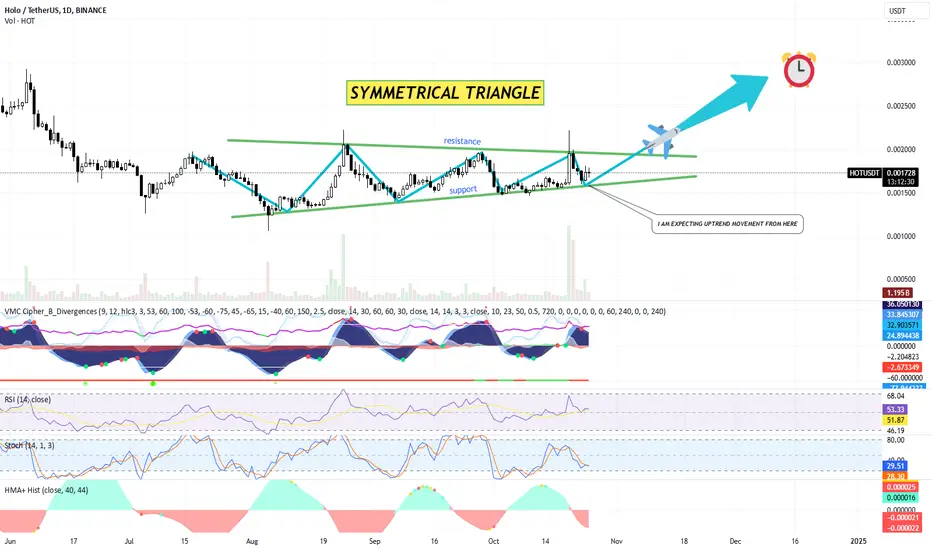
Symmetrical Triangle Pattern: The chart illustrates a clear symmetrical triangle formation. This pattern generally suggests a continuation or breakout of the prevailing trend, but it could go either direction—up or down—depending on the market conditions and volume at the time of the breakout.
Resistance: The top boundary of the triangle has been identified as a resistance level around the 0.002000 USDT mark.
Support: The bottom boundary is acting as support around 0.001500 USDT.
The price is currently consolidating within these converging trendlines, suggesting that a breakout is imminent.
Indicators:
VMC Cipher B Divergences:
The VMC Cipher indicator is showing divergence, hinting at a potential change in momentum.
Positive divergences and green dots indicate buying opportunities, with bullish divergence supporting the breakout hypothesis.
Relative Strength Index (RSI):
Current RSI reading is around 53.55, indicating a neutral zone. There's no clear sign of overbought or oversold conditions. This means the price could go either direction, depending on momentum.
Stochastic RSI:
Stochastic RSI is at 30.09, showing a slightly oversold condition. This suggests that upward momentum might be gaining strength soon.
HMA (Hull Moving Average):
HMA Histogram is currently slightly negative but shows signs of recovery. If it flips to green, it would be another signal for an upward move.
Volume Analysis:
The volume is relatively flat, which is typical during the consolidation phase of a symmetrical triangle. A surge in volume, however, is expected when the price breaks out of the triangle, which will confirm the breakout direction.
Trading Plan for HOLO (HOT):
Scenario 1: Bullish Breakout from the Symmetrical Triangle
Entry Point:
A confirmed breakout above the 0.002000 USDT resistance level with increased volume.
Enter at 0.002050 USDT once the breakout is confirmed to avoid false breakouts.
Target Levels:
First Target: 0.002500 USDT (previous high).
Second Target: 0.003000 USDT, corresponding to the projected move from the triangle breakout.
Stop-Loss:
Place a stop-loss at 0.001800 USDT to protect against false breakouts back into the triangle.
Risk Management:
Consider allocating 2-3% of your portfolio per trade and adjust position size according to risk tolerance.
Scenario 2: Bearish Breakdown from the Symmetrical Triangle
Entry Point:
A confirmed breakdown below 0.001500 USDT with a spike in selling volume.
Enter at 0.001450 USDT once the breakdown is confirmed.
Target Levels:
First Target: 0.001200 USDT, which aligns with historical support.
Second Target: 0.001000 USDT.
Stop-Loss:
Place a stop-loss at 0.001700 USDT in case the breakdown is false.
Risk Management:
As always, only risk a small portion of your capital (2-3%) to avoid heavy losses in a volatile market.
Key Watchpoints:
Volume Confirmation: Watch for a surge in volume when the price nears either the upper or lower boundary of the symmetrical triangle. Volume is a key factor in confirming breakouts.
Market Sentiment: Keep an eye on overall market sentiment for both cryptocurrencies and broader financial markets, as HOLO could be influenced by market-wide movements.
Disclaimer
The information and publications are not meant to be, and do not constitute, financial, investment, trading, or other types of advice or recommendations supplied or endorsed by TradingView. Read more in the Terms of Use.
Disclaimer
The information and publications are not meant to be, and do not constitute, financial, investment, trading, or other types of advice or recommendations supplied or endorsed by TradingView. Read more in the Terms of Use.