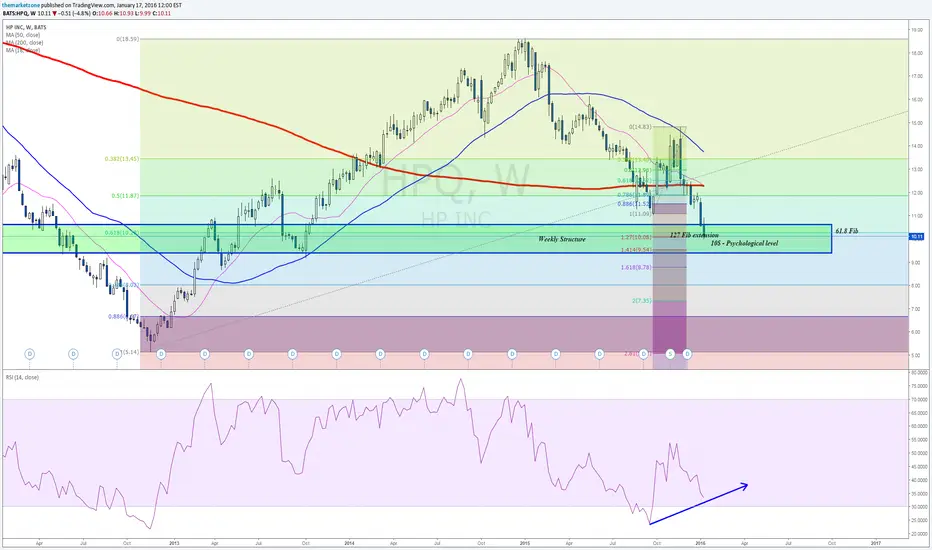
The stock completed a 61.8 Fib retracement and it is now testing a major structure support near the psychological level of 10$
RSI (weekly) shows bullish divergence and in the daily chart we see that the price reached 127 Fib extension level that is considered to be a profit taking target (currently for bears).
9-10$ is the weekly reversal zone to monitor in
Potential targets - 11$, 11.5$ and 12$ (200 weeks SMA line)
Tomer, The MarketZone
This analysis is part of the Weekly Markets Analysis newsletters
To read more interesting technical reviews for the week goo.gl/gg59or
To subscribe to the newsletters - goo.gl/HXjCPV
Follow my blog - goo.gl/78KZsl
Subscribe to my Youtube channel - goo.gl/q8dbyT
Disclaimer
The information and publications are not meant to be, and do not constitute, financial, investment, trading, or other types of advice or recommendations supplied or endorsed by TradingView. Read more in the Terms of Use.
Disclaimer
The information and publications are not meant to be, and do not constitute, financial, investment, trading, or other types of advice or recommendations supplied or endorsed by TradingView. Read more in the Terms of Use.