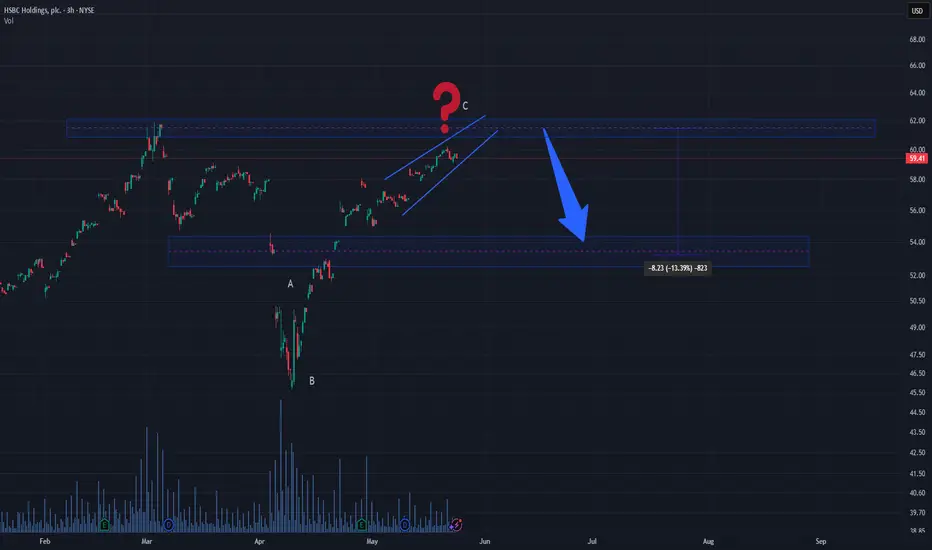
HSBC is currently trading within a rising wedge, but a potential short-term drop of approximately 5% could trigger a full ABC correction pattern. This scenario is not confirmed yet, as the chart remains structurally bullish.
However, should the price reverse and break below the rising channel, it would likely mark the start of wave C, completing an A-B-C corrective sequence. This development could lead the price toward the $54 support zone, which aligns with a previous demand area.
While there is no immediate breakdown or weakness, traders should remain alert. A simple -5% drop might be all it takes to activate the next phase of correction.
Pattern: Potential ABC correction
Trigger: 5% decline from current levels
Target: $54
Bias: Neutral – watch for reaction if price softens
💼 Professional market insights & charts:
cakirinsights.com/
cakirinsights.com/
Disclaimer
The information and publications are not meant to be, and do not constitute, financial, investment, trading, or other types of advice or recommendations supplied or endorsed by TradingView. Read more in the Terms of Use.