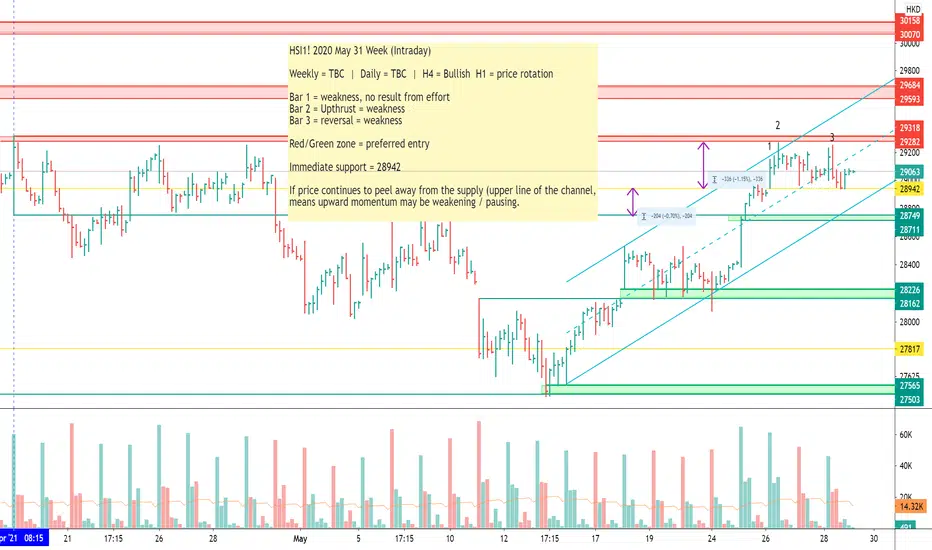
HSI1! 2020 May 31 Week (Intraday)
Weekly = TBC | Daily = TBC | H4 = Bullish H1 = price rotation
Bar 1 = weakness, no result from effort
Bar 2 = Upthrust = weakness
Bar 3 = reversal = weakness
Red/Green zone = preferred entry
Immediate support = 28942
If price continues to peel away from the supply (upper line of the channel,
means upward momentum may be weakening / pausing.
Disclaimer
The information and publications are not meant to be, and do not constitute, financial, investment, trading, or other types of advice or recommendations supplied or endorsed by TradingView. Read more in the Terms of Use.
Disclaimer
The information and publications are not meant to be, and do not constitute, financial, investment, trading, or other types of advice or recommendations supplied or endorsed by TradingView. Read more in the Terms of Use.