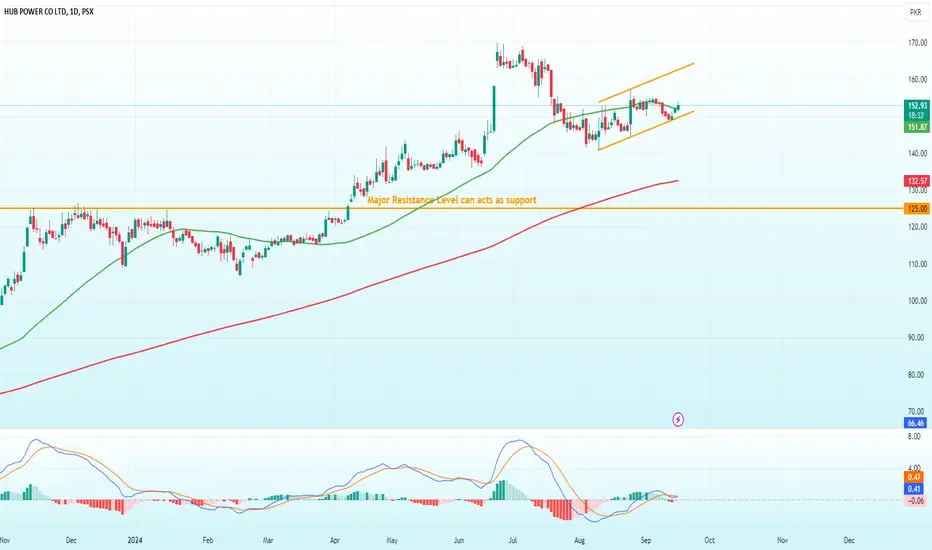
HUBC currently trading in a parallel channel with the closing above 50-day SMA on the daily chart. The stock is in uptrend. MACD is showing a bullish signal, trading above its signal line. Initial support lies around 147 while resistance level defines around 157.
Disclaimer
The information and publications are not meant to be, and do not constitute, financial, investment, trading, or other types of advice or recommendations supplied or endorsed by TradingView. Read more in the Terms of Use.
Disclaimer
The information and publications are not meant to be, and do not constitute, financial, investment, trading, or other types of advice or recommendations supplied or endorsed by TradingView. Read more in the Terms of Use.
