Analysis:
On the monthly timeframe, Humana (HUM) presents an intriguing long-term setup. After a significant multi-year bull run, the stock has experienced a substantial correction from its all-time highs. However, it now finds itself at a critical confluence of long-term support levels, suggesting potential for a significant bounce or a reversal of the recent downtrend.
1. Long-Term Bullish Channel:
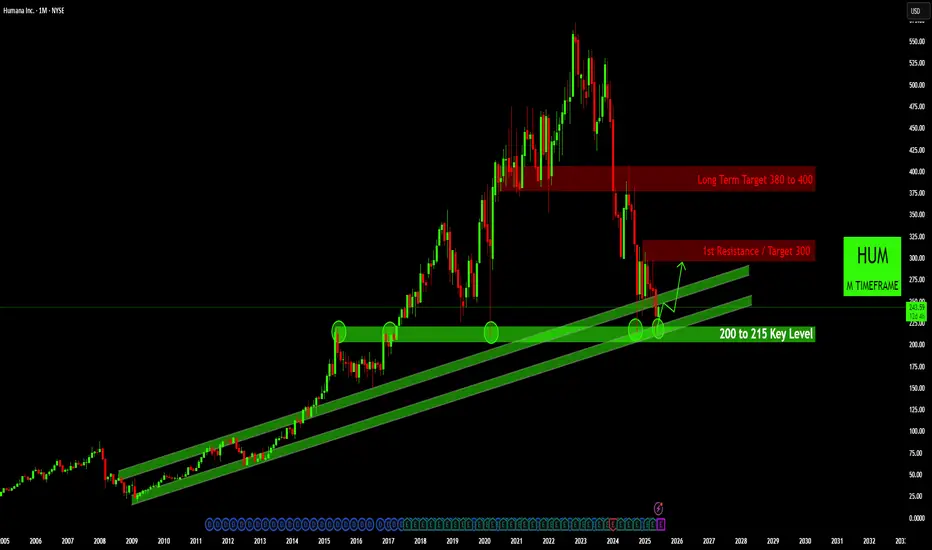
Since the 2008 financial crisis, HUM has been trading within a remarkably well-defined bullish channel (depicted by the two green parallel lines). This channel has guided the price consistently higher for over a decade, with price action respecting both the upper and lower boundaries multiple times.
2. The "200 to 215 Key Level" - A Major Confluence Zone:
* Multi-Touch Support: The price has historically found strong buying interest in this zone, notably during the 2020 market correction and now in the present.
* Trendline Confluence: Crucially, this horizontal support zone perfectly aligns with the lower boundary of the long-term bullish channel. This dual support from both a horizontal key level and the long-term trendline creates a powerful confluence zone, making it a high-probability area for buyers to step in.
Potential Targets (Upside Scenario):
• 1st Resistance / Target $300: Should the 200−215 support hold firm, the immediate upside target for HUM is the $300 level. This zone previously acted as a minor pivot point, where price saw both support and resistance. A break above $300 would confirm bullish momentum.
• Long-Term Target $380 to $400: Beyond the initial 300 target, the next significant long−term target is the∗∗300target, the next significant long−term target is 380 - $400 range. This area previously served as strong support after the initial peak in late 2021/early 2022 before the major breakdown. Reclaiming this zone would signify a substantial recovery and a potential return to previous highs.
• Invalidation & Risk Management:
While the setup appears compelling, it is crucial to consider the downside risk. A decisive monthly close below the $200 level would invalidate this bullish thesis. Such a breakdown would suggest a failure of the long-term trend channel and could lead to further downside, potentially towards the 150−175 region. Traders should monitor price action for confirmation of support and manage their risk accordingly.
Conclusion:
Given the strong historical significance and the powerful confluence of technical indicators at the
200−215 level, Humana (HUM) presents a compelling long-term buy-the-dip opportunity for those looking for a potential reversal and recovery. Patience and confirmation of support at this key level will be paramount.
Disclaimer:
The information provided in this chart is for educational and informational purposes only and should not be considered as investment advice. Trading and investing involve substantial risk and are not suitable for every investor. You should carefully consider your financial situation and consult with a financial advisor before making any investment decisions. The creator of this chart does not guarantee any specific outcome or profit and is not responsible for any losses incurred as a result of using this information. Past performance is not indicative of future results. Use this information at your own risk. This chart has been created for my own improvement in Trading and Investment Analysis. Please do your own analysis before any investments.
On the monthly timeframe, Humana (HUM) presents an intriguing long-term setup. After a significant multi-year bull run, the stock has experienced a substantial correction from its all-time highs. However, it now finds itself at a critical confluence of long-term support levels, suggesting potential for a significant bounce or a reversal of the recent downtrend.
1. Long-Term Bullish Channel:
Since the 2008 financial crisis, HUM has been trading within a remarkably well-defined bullish channel (depicted by the two green parallel lines). This channel has guided the price consistently higher for over a decade, with price action respecting both the upper and lower boundaries multiple times.
2. The "200 to 215 Key Level" - A Major Confluence Zone:
* Multi-Touch Support: The price has historically found strong buying interest in this zone, notably during the 2020 market correction and now in the present.
* Trendline Confluence: Crucially, this horizontal support zone perfectly aligns with the lower boundary of the long-term bullish channel. This dual support from both a horizontal key level and the long-term trendline creates a powerful confluence zone, making it a high-probability area for buyers to step in.
Potential Targets (Upside Scenario):
• 1st Resistance / Target $300: Should the 200−215 support hold firm, the immediate upside target for HUM is the $300 level. This zone previously acted as a minor pivot point, where price saw both support and resistance. A break above $300 would confirm bullish momentum.
• Long-Term Target $380 to $400: Beyond the initial 300 target, the next significant long−term target is the∗∗300target, the next significant long−term target is 380 - $400 range. This area previously served as strong support after the initial peak in late 2021/early 2022 before the major breakdown. Reclaiming this zone would signify a substantial recovery and a potential return to previous highs.
• Invalidation & Risk Management:
While the setup appears compelling, it is crucial to consider the downside risk. A decisive monthly close below the $200 level would invalidate this bullish thesis. Such a breakdown would suggest a failure of the long-term trend channel and could lead to further downside, potentially towards the 150−175 region. Traders should monitor price action for confirmation of support and manage their risk accordingly.
Conclusion:
Given the strong historical significance and the powerful confluence of technical indicators at the
200−215 level, Humana (HUM) presents a compelling long-term buy-the-dip opportunity for those looking for a potential reversal and recovery. Patience and confirmation of support at this key level will be paramount.
Disclaimer:
The information provided in this chart is for educational and informational purposes only and should not be considered as investment advice. Trading and investing involve substantial risk and are not suitable for every investor. You should carefully consider your financial situation and consult with a financial advisor before making any investment decisions. The creator of this chart does not guarantee any specific outcome or profit and is not responsible for any losses incurred as a result of using this information. Past performance is not indicative of future results. Use this information at your own risk. This chart has been created for my own improvement in Trading and Investment Analysis. Please do your own analysis before any investments.
Disclaimer
The information and publications are not meant to be, and do not constitute, financial, investment, trading, or other types of advice or recommendations supplied or endorsed by TradingView. Read more in the Terms of Use.
Disclaimer
The information and publications are not meant to be, and do not constitute, financial, investment, trading, or other types of advice or recommendations supplied or endorsed by TradingView. Read more in the Terms of Use.