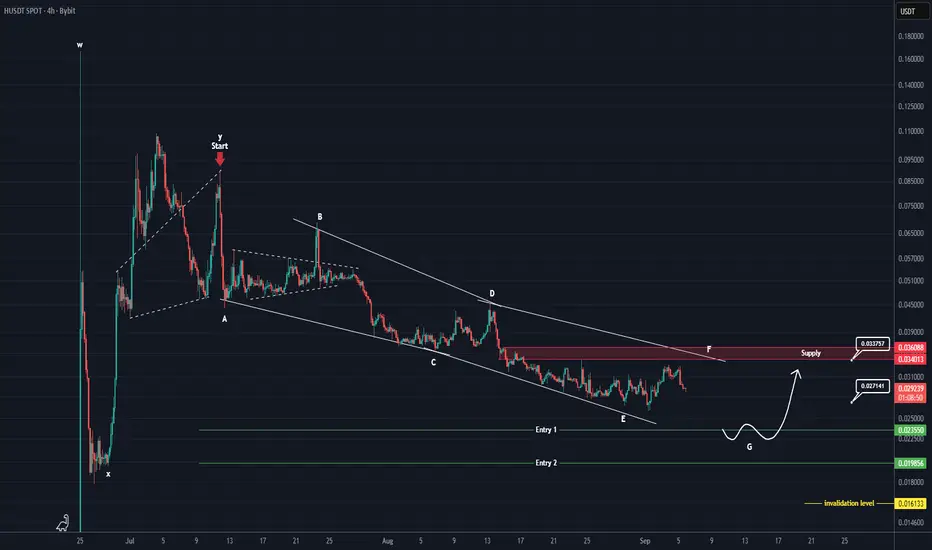
This coin, after completing a bullish wave in the form of a WXY, has entered a corrective phase from the point where we placed the red arrow on the chart.
This phase appears to be a Diametric, and we are currently in wave F of this Diametric.
It is expected that wave G will soon be completed, pushing the price toward the green lines, which mark our entry zone for a buy/long position.
In the green zone, we are looking for a buy/long position. If you are considering a sell/short position, the red-marked box is suggested.
Targets are marked on the chart.
A daily candle close below the invalidation level will invalidate this analysis.
For risk management, please don't forget stop loss and capital management
When we reach the first target, save some profit and then change the stop to entry
Comment if you have any questions
Thank You
🔆To succeed in trading, just enter our Telegram channel:
Free membership: t.me/Behdark_EN
🔷Our Telegram channel has daily spot and futures signals 👉 t.me/Behdark_EN
💎 Exclusive signals are only shared on our Telegram channel
Free membership: t.me/Behdark_EN
🔷Our Telegram channel has daily spot and futures signals 👉 t.me/Behdark_EN
💎 Exclusive signals are only shared on our Telegram channel
Disclaimer
The information and publications are not meant to be, and do not constitute, financial, investment, trading, or other types of advice or recommendations supplied or endorsed by TradingView. Read more in the Terms of Use.