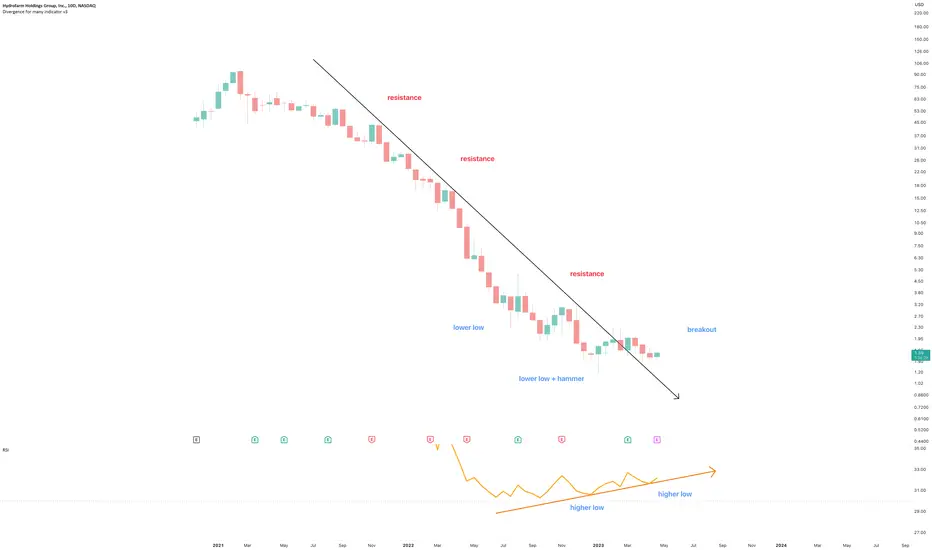
On the above 10-day chart price action has corrected almost 100% since February 2021. A number of reasons now exist to be bullish, including:
1) You know why.
2) Price action confirms support on past resistance.
3) Tripple bullish bullish divergence.
Is it possible price action falls further? Sure.
Is it probable? No.
Ww
Type: investment
Risk: <=6% of portfolio
Timeframe: Until mid-June.
Return: Don’t know
Stop loss: not for TV
1) You know why.
2) Price action confirms support on past resistance.
3) Tripple bullish bullish divergence.
Is it possible price action falls further? Sure.
Is it probable? No.
Ww
Type: investment
Risk: <=6% of portfolio
Timeframe: Until mid-June.
Return: Don’t know
Stop loss: not for TV
Trade active
Note
Did you see the 12-day chart?Trade active
Note
long from 1.10 if you canNote
1.10, bingo.. take it and forget the emotions. Will explain elsewhere why this one..Note
And that is why emotions are ignored.Note
50% in 15 days. Awesome.BTC
bc1q2eckdzh0q8vsd7swcc8et6ze7s99khhxyl7zwy
Weblink: patreon.com/withoutworries
Allow 3-6 months on ideas. Not investment advice. DYOR
bc1q2eckdzh0q8vsd7swcc8et6ze7s99khhxyl7zwy
Weblink: patreon.com/withoutworries
Allow 3-6 months on ideas. Not investment advice. DYOR
Disclaimer
The information and publications are not meant to be, and do not constitute, financial, investment, trading, or other types of advice or recommendations supplied or endorsed by TradingView. Read more in the Terms of Use.
BTC
bc1q2eckdzh0q8vsd7swcc8et6ze7s99khhxyl7zwy
Weblink: patreon.com/withoutworries
Allow 3-6 months on ideas. Not investment advice. DYOR
bc1q2eckdzh0q8vsd7swcc8et6ze7s99khhxyl7zwy
Weblink: patreon.com/withoutworries
Allow 3-6 months on ideas. Not investment advice. DYOR
Disclaimer
The information and publications are not meant to be, and do not constitute, financial, investment, trading, or other types of advice or recommendations supplied or endorsed by TradingView. Read more in the Terms of Use.