This is another short using leverage on gmx plan and set risk/reward accordingly as the risk with margin trading is always very high. Anyways heres some statistics on the rising wedge.
Effectiveness of Wedge Patterns as Indicators
Statistical analyses show that rising wedges lead to price breakdowns over 76% of the time, while falling wedges signal bullish reversals about 68% of the time. The statistical results of wedge patterns serve as a guide, revealing paths to either profit or loss depending on trader interpretations. These compelling metrics highlight the effectiveness of including wedge patterns in trading strategy.
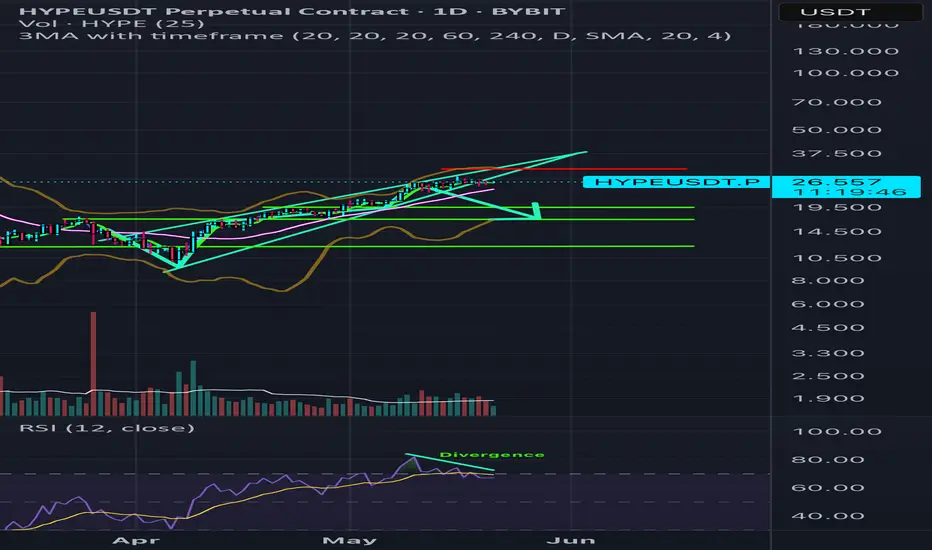
Red line is stop loss greens are targets.
We also have some divergence (bearish) going on. Bearish divergence occurs when the price of an asset makes a higher high while a momentum indicator, like the Relative Strength Index (RSI), makes a lower high. This pattern suggests that the upward momentum is weakening, indicating a potential reversal to a downtrend. This, alone with falling volume throughout the entire wedge is a recipe for a high percentage trade. As always,
GL bois.
Effectiveness of Wedge Patterns as Indicators
Statistical analyses show that rising wedges lead to price breakdowns over 76% of the time, while falling wedges signal bullish reversals about 68% of the time. The statistical results of wedge patterns serve as a guide, revealing paths to either profit or loss depending on trader interpretations. These compelling metrics highlight the effectiveness of including wedge patterns in trading strategy.
Red line is stop loss greens are targets.
We also have some divergence (bearish) going on. Bearish divergence occurs when the price of an asset makes a higher high while a momentum indicator, like the Relative Strength Index (RSI), makes a lower high. This pattern suggests that the upward momentum is weakening, indicating a potential reversal to a downtrend. This, alone with falling volume throughout the entire wedge is a recipe for a high percentage trade. As always,
GL bois.
Disclaimer
The information and publications are not meant to be, and do not constitute, financial, investment, trading, or other types of advice or recommendations supplied or endorsed by TradingView. Read more in the Terms of Use.
Disclaimer
The information and publications are not meant to be, and do not constitute, financial, investment, trading, or other types of advice or recommendations supplied or endorsed by TradingView. Read more in the Terms of Use.