HYPE/USDT – 4H Chart Analysis
Volume (OBV Indicator):
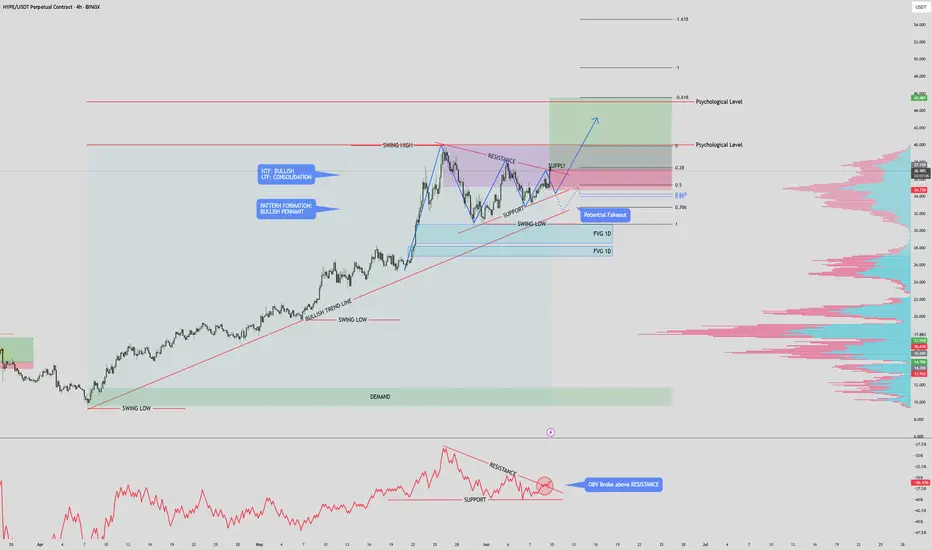
The On-Balance Volume (OBV) has broken above its local resistance level, indicating a notable increase in bullish volume inflow. This supports the current upward momentum.
Market Structure:
High Time Frame (HTF): Still bullish.
Lower Time Frame (LTF): Currently consolidating within a bullish pennant pattern.
Price has recently closed just above the pennant’s resistance line, suggesting a potential breakout and continuation of the bullish trend.
Key Zones & Levels:
Supply Zone: Price is currently testing this zone. A successful hold and breakout above the previous swing high would confirm bullish continuation.
Fair Value Gaps (FVGs):
A small FVG exists just beneath current price between key support/resistance levels. This may act as a short-term magnet for price (potential retracement).
Two larger FVGs on the 1D time frame lie below the current support and prior swing low. If price moves into these levels, it would likely be a liquidity sweep, trap, or fakeout scenario.
Psychological Levels: $40.00 and $45.00 are the next logical upside targets if bullish momentum continues beyond the swing high.
Trade Setup:
Entry: At the 0.28 Fibonacci retracement level.
Stop Loss: Just below the 0.5 Fibonacci level.
Take Profit (Partial): At the 0.618 Fibonacci extension, aligning with a psychological resistance zone.
Summary:
The breakout from the bullish pennant, combined with increasing volume (OBV breakout), suggests strong bullish momentum. As long as price holds above the pennant and key support, continuation toward $40–$45 remains the probable scenario. Any dip into the lower FVGs would likely be a liquidity event rather than a trend reversal.
(NOTE: This is not financial advice, it is recommended to always (DYOR) (Do Your Own Research)
Volume (OBV Indicator):
The On-Balance Volume (OBV) has broken above its local resistance level, indicating a notable increase in bullish volume inflow. This supports the current upward momentum.
Market Structure:
High Time Frame (HTF): Still bullish.
Lower Time Frame (LTF): Currently consolidating within a bullish pennant pattern.
Price has recently closed just above the pennant’s resistance line, suggesting a potential breakout and continuation of the bullish trend.
Key Zones & Levels:
Supply Zone: Price is currently testing this zone. A successful hold and breakout above the previous swing high would confirm bullish continuation.
Fair Value Gaps (FVGs):
A small FVG exists just beneath current price between key support/resistance levels. This may act as a short-term magnet for price (potential retracement).
Two larger FVGs on the 1D time frame lie below the current support and prior swing low. If price moves into these levels, it would likely be a liquidity sweep, trap, or fakeout scenario.
Psychological Levels: $40.00 and $45.00 are the next logical upside targets if bullish momentum continues beyond the swing high.
Trade Setup:
Entry: At the 0.28 Fibonacci retracement level.
Stop Loss: Just below the 0.5 Fibonacci level.
Take Profit (Partial): At the 0.618 Fibonacci extension, aligning with a psychological resistance zone.
Summary:
The breakout from the bullish pennant, combined with increasing volume (OBV breakout), suggests strong bullish momentum. As long as price holds above the pennant and key support, continuation toward $40–$45 remains the probable scenario. Any dip into the lower FVGs would likely be a liquidity event rather than a trend reversal.
(NOTE: This is not financial advice, it is recommended to always (DYOR) (Do Your Own Research)
Trade active
Enjoy the profits.
Note
Just as predicted,
Congratulations to those who took this trade.
Trade closed: target reached
GGDisclaimer
The information and publications are not meant to be, and do not constitute, financial, investment, trading, or other types of advice or recommendations supplied or endorsed by TradingView. Read more in the Terms of Use.
Disclaimer
The information and publications are not meant to be, and do not constitute, financial, investment, trading, or other types of advice or recommendations supplied or endorsed by TradingView. Read more in the Terms of Use.