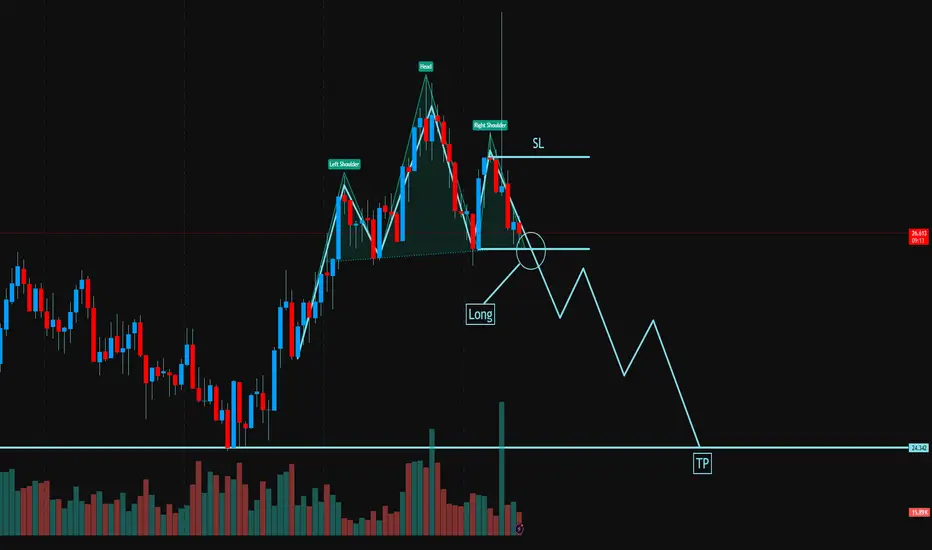
The chart reveals a classic Head and Shoulders pattern formation, signaling a potential bearish reversal in the current trend. This is a well-known structure used by traders to anticipate market turnarounds after an uptrend.
🧩 Pattern Structure:
Left Shoulder, Head, Right Shoulder: Clearly defined, suggesting the exhaustion of bullish momentum.
Neckline Break: Price has just broken below the neckline support (circled zone), triggering a potential short opportunity.
Entry (Short Position): Ideal entry is just below the neckline confirmation, where price breaks down and retests the zone.
Stop Loss (SL): Placed above the right shoulder – a break above this level would invalidate the pattern.
Take Profit (TP): The target is projected based on the height from the head to the neckline, pointing to the 24.34 level as the main downside objective.
📉 Conclusion:
This setup presents a clean bearish opportunity with a well-defined risk-to-reward ratio. If price sustains below the neckline with momentum, we could see a continuation toward the TP level. Traders should remain cautious and manage risk accordingly. ⚠️
Disclaimer
The information and publications are not meant to be, and do not constitute, financial, investment, trading, or other types of advice or recommendations supplied or endorsed by TradingView. Read more in the Terms of Use.
Disclaimer
The information and publications are not meant to be, and do not constitute, financial, investment, trading, or other types of advice or recommendations supplied or endorsed by TradingView. Read more in the Terms of Use.