Weekly Chart Analysis of HYPEUSDT
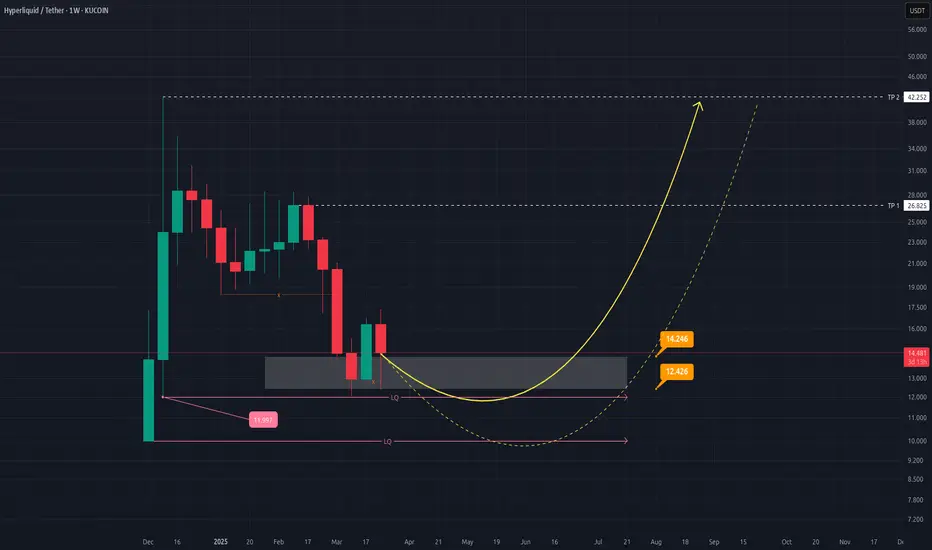
The weekly chart of HYPEUSDT reflects a critical phase where the price is consolidating within a key demand zone, suggesting potential for a bullish reversal. Below is the detailed analysis:
Key Observations:
Demand Zone: The price is currently hovering around the highlighted gray box, which represents a strong liquidity zone (LQ) between $12.426 and $14.246. This area has historically acted as support, and a bounce from here could signal a reversal.
Support Levels:
Immediate support lies at $12.426.
A deeper correction could test the $11.997 and $10.000 levels, which are marked as liquidity levels below the current zone.
Bullish Scenario:
If the price holds above the current demand zone, it could initiate a rounded bottom pattern (illustrated by the yellow curved line).
The first target (TP1) for this potential upside move is $26.825.
The second target (TP2), representing a more extended rally, is projected at $42.252.
Candlestick Structure: Recent weekly candles show indecision, but if buyers step in strongly, it could confirm bullish momentum.
Risk Management:
Traders should monitor for any breakdown below the $12.426 level, as it may invalidate the bullish setup and lead to further downside toward $10.000.
Conclusion:
HYPEUSDT shows promising signs of recovery from its demand zone, with upside targets at $26.825 and $42.252 in sight if bullish momentum builds. However, caution is advised until clear confirmation of reversal occurs.
This analysis provides a roadmap for both short-term and long-term traders to plan their entries and exits effectively.
[Current date: Thursday, March 27, 2025]
Note
Nice reaction to the weekly zone!Note
So Nice Analysis!Disclaimer
The information and publications are not meant to be, and do not constitute, financial, investment, trading, or other types of advice or recommendations supplied or endorsed by TradingView. Read more in the Terms of Use.
Disclaimer
The information and publications are not meant to be, and do not constitute, financial, investment, trading, or other types of advice or recommendations supplied or endorsed by TradingView. Read more in the Terms of Use.