Yello, Paradisers! Could we be moments away from #HYPE’s next explosive leg up? The chart is giving us some big clues right now…
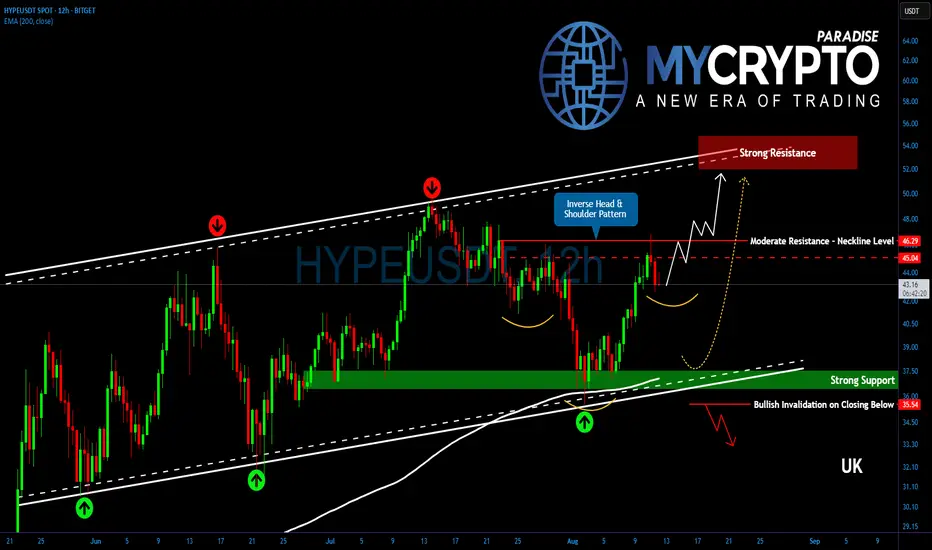
💎HYPE continues to stand out as one of the market’s strongest altcoins, maintaining its climb inside a well-defined ascending channel. On top of that, an inverse head and shoulders pattern is taking shape, a classic bullish signal hinting at further strength ahead.
💎Currently, #HYPEUSDT is pressing against a key resistance zone at 45.05–46.30, which also lines up perfectly with the neckline of the emerging pattern. This is a moderate but crucial area for bulls to conquer.
💎If we see a clean breakout above this range, supported by strong buying volume, it would confirm the bullish pattern and likely propel price toward the 52–54 zone, right where the top of the channel is positioned.
💎On the downside, minor support lies between 43.00–41.90. Losing this zone could open the way for a deeper pullback toward the 37.50 region, where the EMA-200 offers strong technical support.
Paradisers, strive for consistency, not quick profits. Treat the market as a businessman, not as a gambler.
MyCryptoParadise
iFeel the success🌴
Want to trade like a PRO without the 15+ year learning curve?
🫳Steal the edge - follow seasoned team of traders at mycryptoparadise.com (FREE)
✅🎖️Or go full throttle with PRO strategy + killer entry/exit signals - t.me/MCPsupportbot
🫳Steal the edge - follow seasoned team of traders at mycryptoparadise.com (FREE)
✅🎖️Or go full throttle with PRO strategy + killer entry/exit signals - t.me/MCPsupportbot
Disclaimer
The information and publications are not meant to be, and do not constitute, financial, investment, trading, or other types of advice or recommendations supplied or endorsed by TradingView. Read more in the Terms of Use.