Bollinger Bands :
Volume :
Trend :
Support and Resistance :
Conclusion :
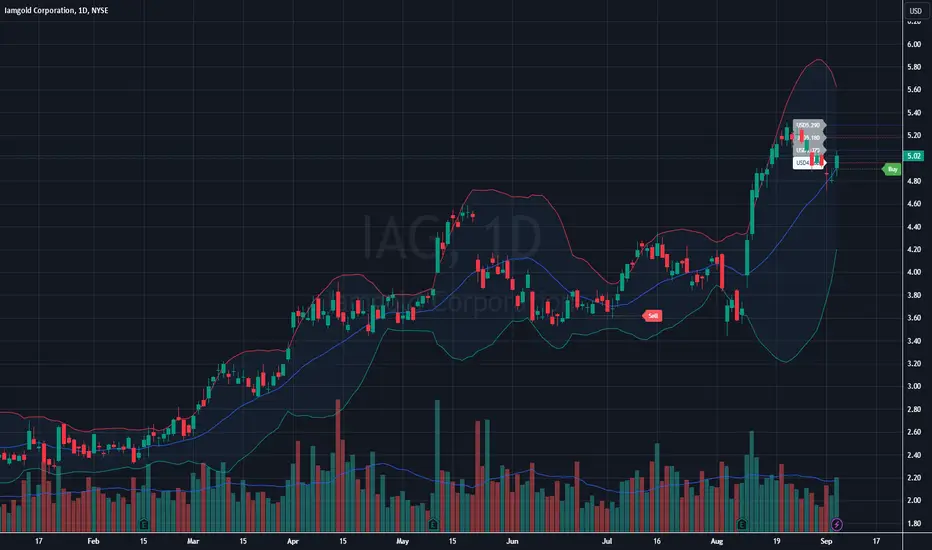
- The chart has Bollinger Bands, which help identify volatility and potential overbought or oversold conditions.
- The price is currently near the upper Bollinger Band, indicating that the stock is potentially overbought in the short term.
- There was a recent touch of the upper band, followed by a pullback towards the middle band (20-day moving average), suggesting the possibility of consolidation or correction.
Volume :
- There is a notable volume spike in recent days, which often indicates increased investor interest or significant buying/selling pressure.
- This higher volume, coupled with the recent price increase, supports the idea of strong buying interest.
Trend :
- The stock is in a clear uptrend since early 2024, with a strong rally that peaked recently. This rally saw the stock break above previous resistance levels, with a recent high near $5.60.
- However, after hitting this high, the price started pulling back, suggesting profit-taking or a pause in the rally.
Support and Resistance :
- Resistance: The most recent peak around $5.60 serves as the immediate resistance level. The stock would need to break and hold above this level to continue the uptrend.
- Support: The middle Bollinger Band (around $4.70) and the 50-day moving average (around $4.50) are key support levels to watch. If the price drops below these, it may indicate a deeper correction.
Conclusion :
- Bullish View: The stock is still in an uptrend, supported by both the moving averages and the Bollinger Bands. However, a pullback or consolidation around the $4.70-$4.80 level is possible before attempting to retest the recent highs.
- Bearish View: If the price falls below the 50-day MA and the middle Bollinger Band, a larger correction could be in play, with the next support around $4.50.
➀➁➂➃➄
Disclaimer
The information and publications are not meant to be, and do not constitute, financial, investment, trading, or other types of advice or recommendations supplied or endorsed by TradingView. Read more in the Terms of Use.
➀➁➂➃➄
Disclaimer
The information and publications are not meant to be, and do not constitute, financial, investment, trading, or other types of advice or recommendations supplied or endorsed by TradingView. Read more in the Terms of Use.