The Biotech bubble bursting hits Nasdaq and makes it the weaker link in the indices chain.
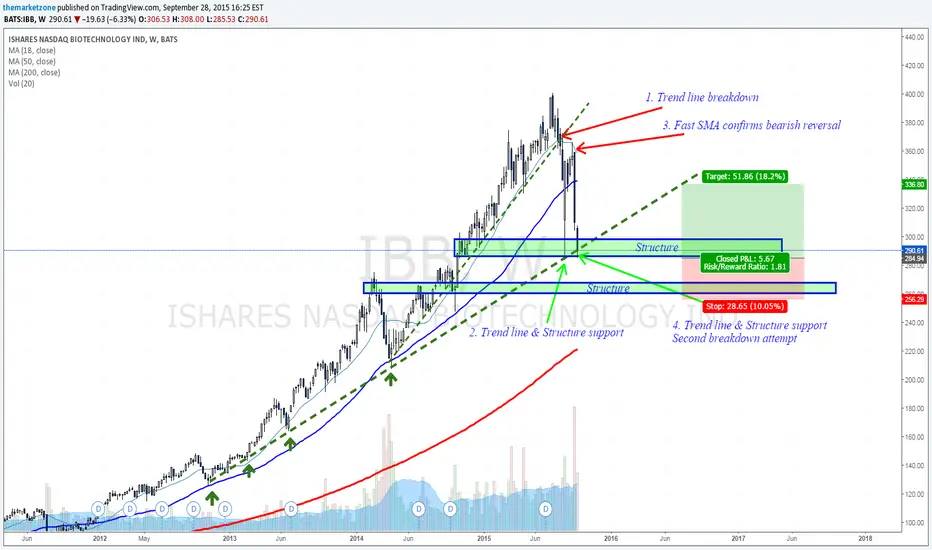
It all began when IBB broke below 360$, closing below its Fast SMA line, providing the bearish signal by breaking down the weekly uptrend line (see point 1)
August's declines leadIBB to re-test another weekly uptrend line and the 300$ support zone - This created a rally back towards 360$ that ended when the price was rejected by the 360 structure and the Fast SMA line that flipped roles to resistance.
Now, three week's later,IBB is re-testing the 300$ (currently inside the zone). It is also re-testing the same uptrend that helped it during August.
That is a critical zone for Biotech. The next support zone is near 260$ and below it, the 200 weeks MA waits near 230$.
IfIBB will manage to find the necessary support inside 280-300$ again, it could lead to a rally towards its 50 weeks MA line that should turn to resistance now.
A close above 300$ could be a bullish confirmation signal that we are heading there.
Follow me on TradingView
Follow my blog: marketzone.tumblr.com/
Subscribe to my newsletters: goo.gl/psNTqg
It all began when
August's declines lead
Now, three week's later,
That is a critical zone for Biotech. The next support zone is near 260$ and below it, the 200 weeks MA waits near 230$.
If
A close above 300$ could be a bullish confirmation signal that we are heading there.
Follow me on TradingView
Follow my blog: marketzone.tumblr.com/
Subscribe to my newsletters: goo.gl/psNTqg
Note
Related publications
Disclaimer
The information and publications are not meant to be, and do not constitute, financial, investment, trading, or other types of advice or recommendations supplied or endorsed by TradingView. Read more in the Terms of Use.
Related publications
Disclaimer
The information and publications are not meant to be, and do not constitute, financial, investment, trading, or other types of advice or recommendations supplied or endorsed by TradingView. Read more in the Terms of Use.