IBIT, the new Bitcoin ETF, is carving out a clear structure right now. If you’ve been following my updates, you know I only share setups backed by solid signals—and this one fits the bill.
🟢 Support Zone
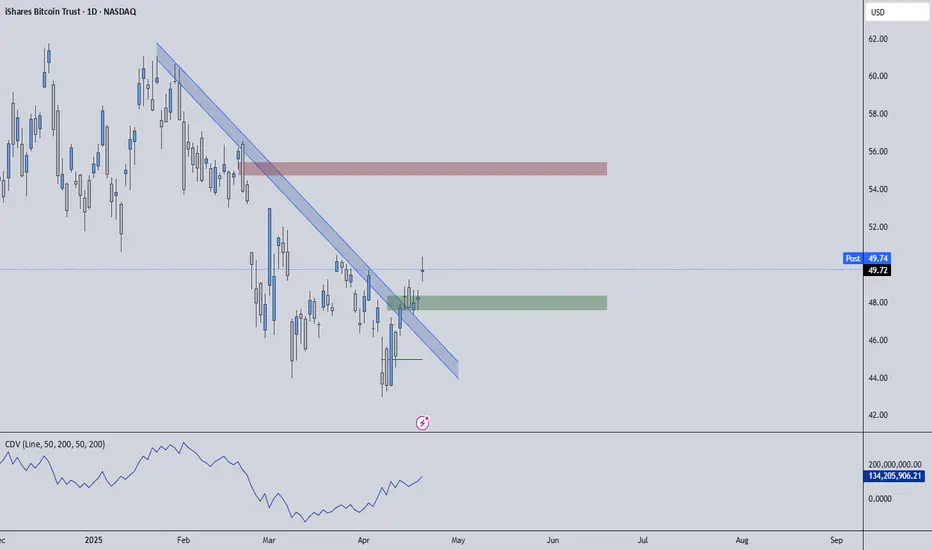
The green box marks the first area where buyers have shown up and defended price. If IBIT pulls back into this zone and holds, it’s where I’ll look for signs of renewed demand—think clean higher‑lows on a 5‑ or 15‑minute chart, accompanied by positive CDV shifts and rising volume.
🔴 First Strong Resistance
Above the current price, the red box stands as the first major hurdle. Historically, these levels have prompted sellers to step in aggressively. A rally into this zone demands caution—watch for lower‑time‑frame breakdowns and volume confirmation before considering any short entries.
🎯 Trading Plan
Long from Support
Wait for a drop into the green box. If price forms a strong base there with LTF breakout confirmation, that’s my cue to enter long.
Short at Resistance
If IBIT reaches the red box and shows clear exhaustion—lower‑time‑frame structure breaks and CDV weaknesses—then I’ll look for a short opportunity.
Adapt with the Market
I will not insist on any bias. If price breaks above the red box with conviction and retests it as support, I will switch to a bullish view. If the green box breaks without retest, I’ll reassess and stay patient.
💡 Why This Matters
You’re not just following random boxes—you’re trading with a proven framework that has delivered one of the highest success rates you’ll find. Every level I share comes from careful analysis and live‑market testing. Stick with this approach, and you’ll trade with confidence rather than guesswork.
📌I keep my charts clean and simple because I believe clarity leads to better decisions.
📌My approach is built on years of experience and a solid track record. I don’t claim to know it all but I’m confident in my ability to spot high-probability setups.
📌If you would like to learn how to use the heatmap, cumulative volume delta and volume footprint techniques that I use below to determine very accurate demand regions, you can send me a private message. I help anyone who wants it completely free of charge.
🔑I have a long list of my proven technique below:
I stopped adding to the list because it's kinda tiring to add 5-10 charts in every move but you can check my profile and see that it goes on..
🟢 Support Zone
The green box marks the first area where buyers have shown up and defended price. If IBIT pulls back into this zone and holds, it’s where I’ll look for signs of renewed demand—think clean higher‑lows on a 5‑ or 15‑minute chart, accompanied by positive CDV shifts and rising volume.
🔴 First Strong Resistance
Above the current price, the red box stands as the first major hurdle. Historically, these levels have prompted sellers to step in aggressively. A rally into this zone demands caution—watch for lower‑time‑frame breakdowns and volume confirmation before considering any short entries.
🎯 Trading Plan
Long from Support
Wait for a drop into the green box. If price forms a strong base there with LTF breakout confirmation, that’s my cue to enter long.
Short at Resistance
If IBIT reaches the red box and shows clear exhaustion—lower‑time‑frame structure breaks and CDV weaknesses—then I’ll look for a short opportunity.
Adapt with the Market
I will not insist on any bias. If price breaks above the red box with conviction and retests it as support, I will switch to a bullish view. If the green box breaks without retest, I’ll reassess and stay patient.
💡 Why This Matters
You’re not just following random boxes—you’re trading with a proven framework that has delivered one of the highest success rates you’ll find. Every level I share comes from careful analysis and live‑market testing. Stick with this approach, and you’ll trade with confidence rather than guesswork.
📌I keep my charts clean and simple because I believe clarity leads to better decisions.
📌My approach is built on years of experience and a solid track record. I don’t claim to know it all but I’m confident in my ability to spot high-probability setups.
📌If you would like to learn how to use the heatmap, cumulative volume delta and volume footprint techniques that I use below to determine very accurate demand regions, you can send me a private message. I help anyone who wants it completely free of charge.
🔑I have a long list of my proven technique below:
- 🎯 ZENUSDT.P: Patience & Profitability | %230 Reaction from the Sniper Entry
- 🐶 DOGEUSDT.P: Next Move
- 🎨 RENDERUSDT.P: Opportunity of the Month
- 💎 ETHUSDT.P: Where to Retrace
- 🟢 BNBUSDT.P: Potential Surge
- 📊 BTC Dominance: Reaction Zone
- 🌊 WAVESUSDT.P: Demand Zone Potential
- 🟣 UNIUSDT.P: Long-Term Trade
- 🔵 XRPUSDT.P: Entry Zones
- 🔗 LINKUSDT.P: Follow The River
- 📈 BTCUSDT.P: Two Key Demand Zones
- 🟩 POLUSDT: Bullish Momentum
- 🌟 PENDLEUSDT.P: Where Opportunity Meets Precision
- 🔥 BTCUSDT.P: Liquidation of Highly Leveraged Longs
- 🌊 SOLUSDT.P: SOL's Dip - Your Opportunity
- 🐸 1000PEPEUSDT.P: Prime Bounce Zone Unlocked
- 🚀 ETHUSDT.P: Set to Explode - Don't Miss This Game Changer
- 🤖 IQUSDT: Smart Plan
- ⚡️ PONDUSDT: A Trade Not Taken Is Better Than a Losing One
- 💼 STMXUSDT: 2 Buying Areas
- 🐢 TURBOUSDT: Buy Zones and Buyer Presence
- 🌍 ICPUSDT.P: Massive Upside Potential | Check the Trade Update For Seeing Results
- 🟠 IDEXUSDT: Spot Buy Area | %26 Profit if You Trade with MSB
- 📌 USUALUSDT: Buyers Are Active + %70 Profit in Total
- 🌟 FORTHUSDT: Sniper Entry +%26 Reaction
- 🐳 QKCUSDT: Sniper Entry +%57 Reaction
- 📊 BTC.D: Retest of Key Area Highly Likely
- 📊 XNOUSDT %80 Reaction with a Simple Blue Box!
- 📊 BELUSDT Amazing %120 Reaction!
I stopped adding to the list because it's kinda tiring to add 5-10 charts in every move but you can check my profile and see that it goes on..
Professional Day Trader
Microstructure Practicioner
t.me/umuttrades
kick.com/umuttrades live everyday.
Microstructure Practicioner
t.me/umuttrades
kick.com/umuttrades live everyday.
Related publications
Disclaimer
The information and publications are not meant to be, and do not constitute, financial, investment, trading, or other types of advice or recommendations supplied or endorsed by TradingView. Read more in the Terms of Use.