Hello Community!
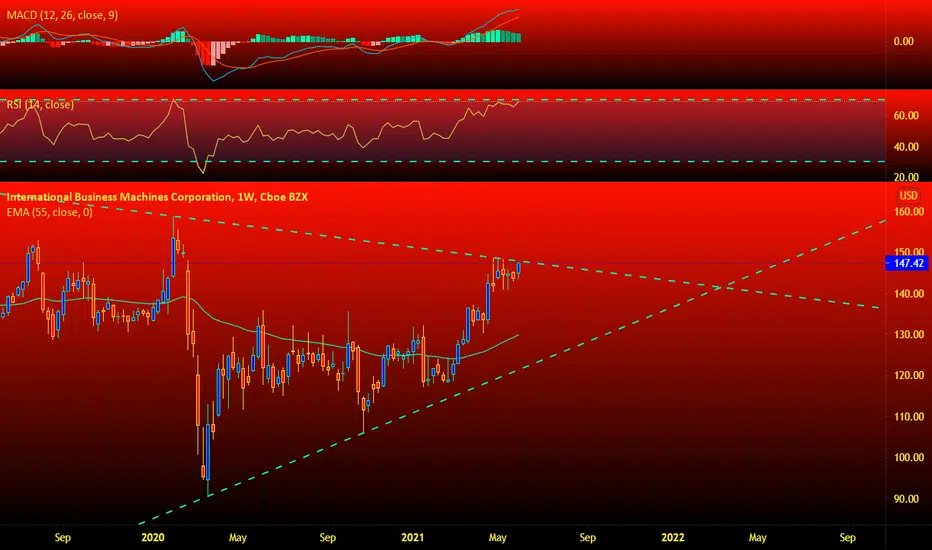
When looking at IBM we can see it clearly trading at the top of the triangle shown on the weekly TF. This has been a powerful rejection area in the past. We have to also take into consideration the more a S/R zone is tested the weaker it gets. The MACD is beginning to tick down and the RSI is showing overbought. I can see a rejection happening from here, which would be a great place to start a short with a tight stop-loss. If entering a trade don't forget to use a stop-loss. Don't trade with what you're not willing to lose.
Love it or hate it, hit that thumbs up and comment. It'll be greatly appreciated!
This is not financial advice.
Safe Trading. Calculate Your Risk/Reward & Collect!
Simplicity Wins (
Disclaimer
The information and publications are not meant to be, and do not constitute, financial, investment, trading, or other types of advice or recommendations supplied or endorsed by TradingView. Read more in the Terms of Use.
Disclaimer
The information and publications are not meant to be, and do not constitute, financial, investment, trading, or other types of advice or recommendations supplied or endorsed by TradingView. Read more in the Terms of Use.