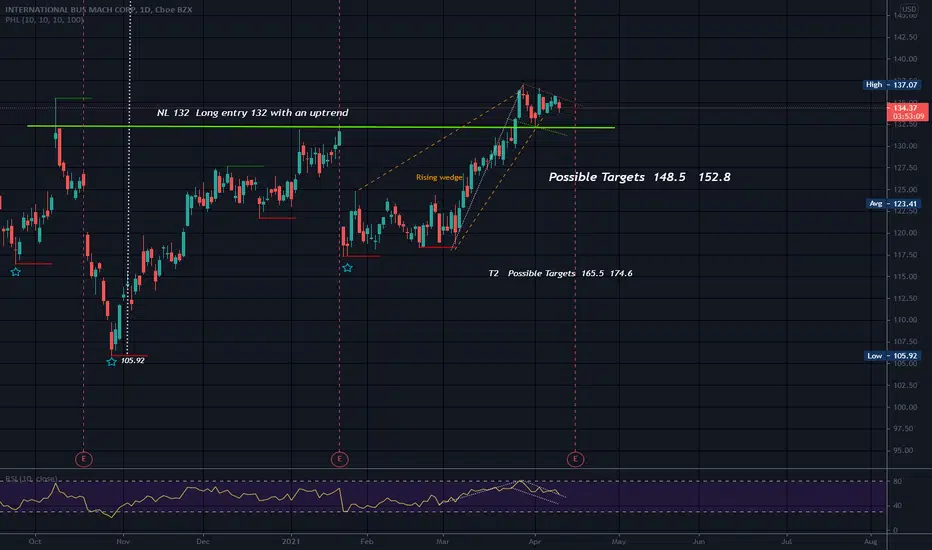
Possible bearish rising wedge. I am not sure but there is also a possible bull flag as well.
I have noticed a bull flag will often take a security through the bearish rising wedge and then recover. If so, this would take price back down to long entry level for the inverse H&S bottom, or possibly lower.
Rising wedges are usually bearish, well almost always bearish. They form due to overactive buying and can be very long term patterns. They are not valid unless lower trendline is broken. A strong stock may not fall far and will seek a level of support within the wedge. A rising wedge has 2 trendlines that converge at the apex.
Not a recommendation.
RSI is not overbought or oversold and a flag like structure is forming there as well.
Leading indicators are a heads-up for economists and investors who hope to anticipate trends. RSI is considered a leading indicator. Leading indicators react to prices quickly, which can be great for short-term traders, but makes them prone to giving out false signals.
Lagging indicators can only be known after the event, but that doesn't make them useless. They can confirm trends and what has been occurring over time. Analysts are a lagging indicator (o:
The MACD is a lagging indicator when trading on the crossovers, it is more of a leading indicator when it is used to highlight possible overbought or oversold conditions.
Note
Has broken bottom trendline of the bearish rising wedge 4/13Disclaimer
The information and publications are not meant to be, and do not constitute, financial, investment, trading, or other types of advice or recommendations supplied or endorsed by TradingView. Read more in the Terms of Use.
Disclaimer
The information and publications are not meant to be, and do not constitute, financial, investment, trading, or other types of advice or recommendations supplied or endorsed by TradingView. Read more in the Terms of Use.