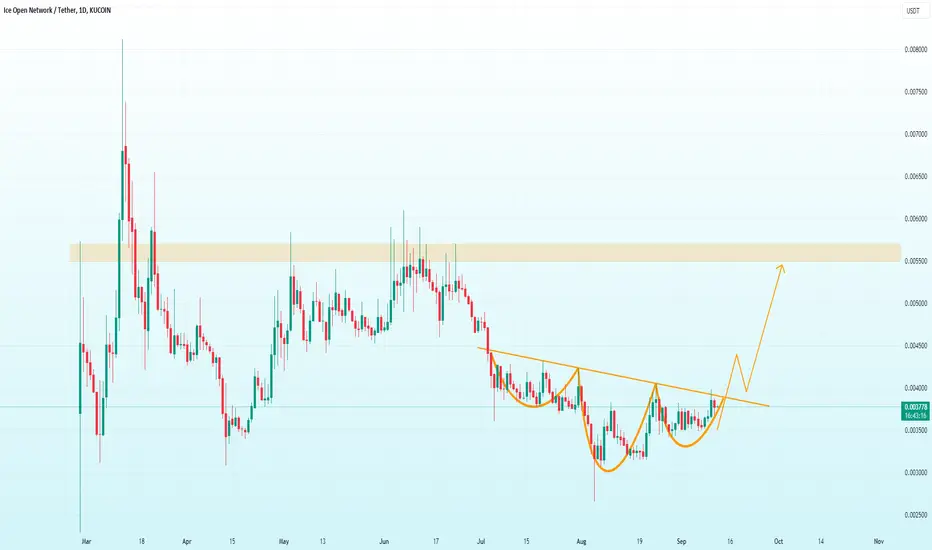
The chart shows a potential inverse head and shoulders pattern, which is a bullish reversal signal. The price is testing the neckline, and a successful breakout could lead to a significant move upwards toward the resistance zone around 0.005500 USDT. This pattern suggests that the market may be reversing its downtrend, with the highlighted resistance acting as a key level to watch. A breakout with increased volume would confirm the bullish trend, but failure to breach the neckline could result in consolidation or a pullback.
Trade closed: target reached
🚀🚀🚀🚀Disclaimer
The information and publications are not meant to be, and do not constitute, financial, investment, trading, or other types of advice or recommendations supplied or endorsed by TradingView. Read more in the Terms of Use.
Disclaimer
The information and publications are not meant to be, and do not constitute, financial, investment, trading, or other types of advice or recommendations supplied or endorsed by TradingView. Read more in the Terms of Use.