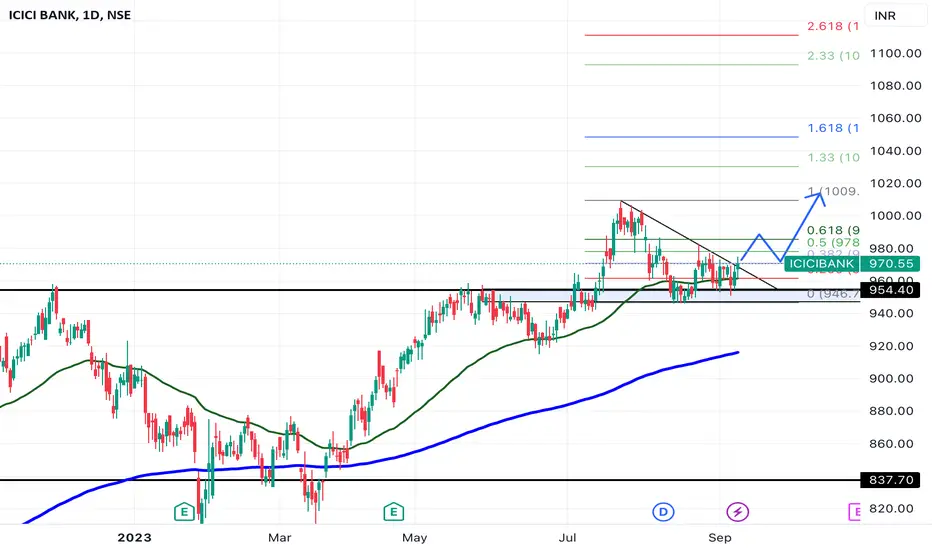
technicals suggest a gradual upside in ICICI BANK. There are multiple confirmations for the same. The reasons are stated below :
Stock could easily move unto 1050 - 1111 levels in coming weeks.
- 954 levels previously acted as a strong resistance and now the stock price broke 954 levels, which now acts as a support.
- there has been a consolidation in the stock price for last 2months forming a falling wedge pattern(bullish sign)
- support on the 50EMA (ON DAILY TF)
- break of the trend line
Stock could easily move unto 1050 - 1111 levels in coming weeks.
Note
currently, stock is up by 2% from our buying price and formed 2 doji candles which indeed shows that the price is trying to sustain on upper levelsNote
ICICI BANK retested the 950 levels which seems to be a strong support and formed a bullish candle.
ADVICE : can hold with a tight SL of 935
Note
SL just got saved.price returned from 935 twice and
formed a hammer candle twice.
we'll hold onto to the trade with SL of 935(on closing basis)
Note
One can still hold onto the stock.With the same SL.
If we get a strong close below 935, we'll exit.
Note
SL HIT !!!EXIT from this trade.
---- END ----
Disclaimer
The information and publications are not meant to be, and do not constitute, financial, investment, trading, or other types of advice or recommendations supplied or endorsed by TradingView. Read more in the Terms of Use.
Disclaimer
The information and publications are not meant to be, and do not constitute, financial, investment, trading, or other types of advice or recommendations supplied or endorsed by TradingView. Read more in the Terms of Use.