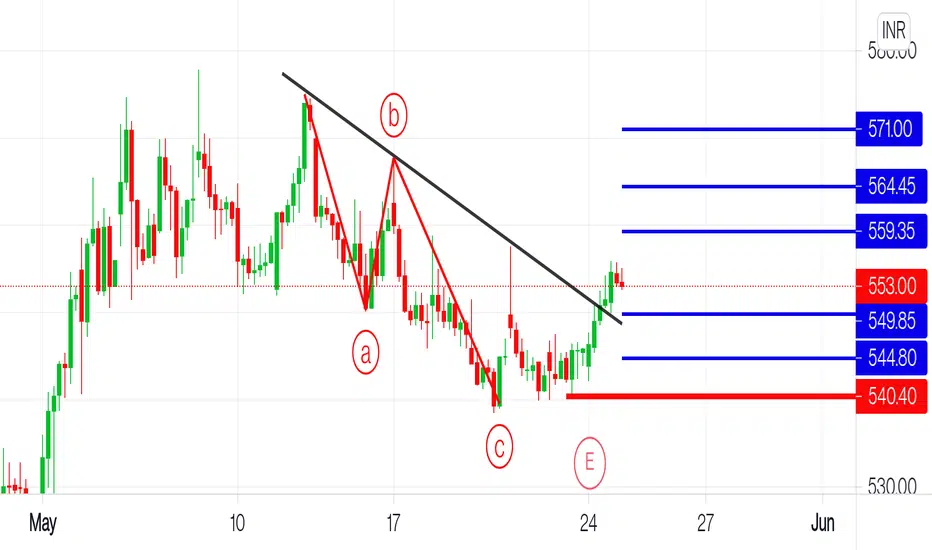
Looks like beginning of new impulse on Hourly time frame
One can go Long now or in dips with stoploss of 540
All the key levels are mentioned in chart with Stop-loss and Targets
Elliotts view

Key Levels are Mentioned on chart

Bollinger

Weekly MACD

Hourly MACD

DMI ADX UNGALI POSITIVE

RSI in daily above 60

RSI in hourly above 60

One can go Long now or in dips with stoploss of 540
All the key levels are mentioned in chart with Stop-loss and Targets
Elliotts view
Key Levels are Mentioned on chart
Bollinger
Weekly MACD
Hourly MACD
DMI ADX UNGALI POSITIVE
RSI in daily above 60
RSI in hourly above 60
Trade closed: stop reached
YouTube: youtube.com/@rk_charts
Telegram : t.me/RK_Charts
Twitter : @charts_rk
Email : rkcharts@gmail. com
Disclaimer.
I am not sebi registered analyst.
My studies are for educational purpose only.
Telegram : t.me/RK_Charts
Twitter : @charts_rk
Email : rkcharts@gmail. com
Disclaimer.
I am not sebi registered analyst.
My studies are for educational purpose only.
Related publications
Disclaimer
The information and publications are not meant to be, and do not constitute, financial, investment, trading, or other types of advice or recommendations supplied or endorsed by TradingView. Read more in the Terms of Use.