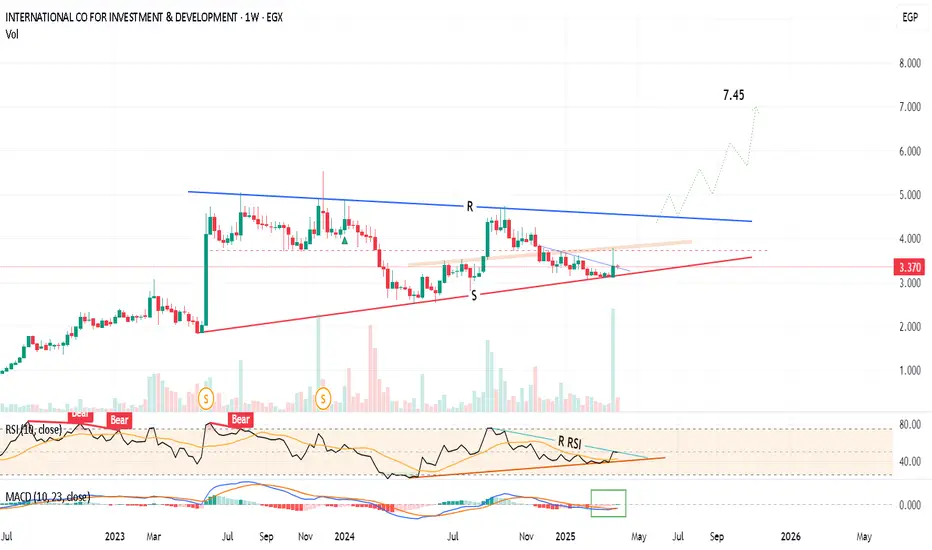
Weekly chart,
The stock ICID is trading inside a symmetrical triangle pattern between Support and Resistance lines (S and R)
The technical indicator RSI can be seen as drawing the same pattern (waiting for crossing up the R RSI line as a confirmation).
MACD is crossing up its signal line.. However, it is still technically negative.
So, I can expect a new bullish movement towards the Resistance line (at around 4.45)
Crossing up the R line and trading above it for 3 weeks - with high volume, the long term target will be 7.45
NOTE: Consider a near profit protection / stop loss level for this stock, as it is volatile and impulsive!
The stock
The technical indicator RSI can be seen as drawing the same pattern (waiting for crossing up the R RSI line as a confirmation).
MACD is crossing up its signal line.. However, it is still technically negative.
So, I can expect a new bullish movement towards the Resistance line (at around 4.45)
Crossing up the R line and trading above it for 3 weeks - with high volume, the long term target will be 7.45
NOTE: Consider a near profit protection / stop loss level for this stock, as it is volatile and impulsive!
Disclaimer
The information and publications are not meant to be, and do not constitute, financial, investment, trading, or other types of advice or recommendations supplied or endorsed by TradingView. Read more in the Terms of Use.
Disclaimer
The information and publications are not meant to be, and do not constitute, financial, investment, trading, or other types of advice or recommendations supplied or endorsed by TradingView. Read more in the Terms of Use.