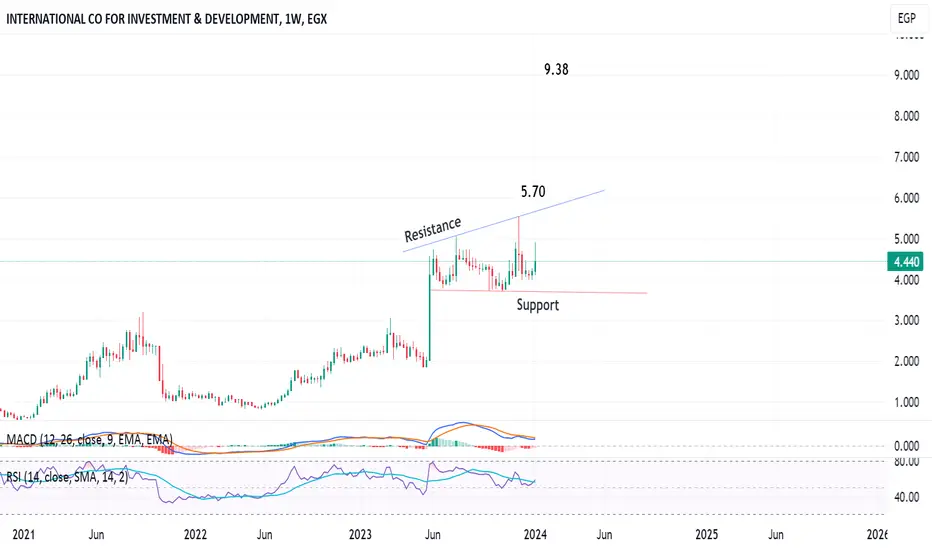
Weekly chart, the stock is trading in an expanding triangle, with positive technical indicators RSI and MACD.
After crossing the resistance line (BLUE) - at around 5.7, the target will be 9.38
Below the support line, the stop loss should be considered.
After crossing the resistance line (BLUE) - at around 5.7, the target will be 9.38
Below the support line, the stop loss should be considered.
Related publications
Disclaimer
The information and publications are not meant to be, and do not constitute, financial, investment, trading, or other types of advice or recommendations supplied or endorsed by TradingView. Read more in the Terms of Use.
Related publications
Disclaimer
The information and publications are not meant to be, and do not constitute, financial, investment, trading, or other types of advice or recommendations supplied or endorsed by TradingView. Read more in the Terms of Use.