📊 Technical Overview:
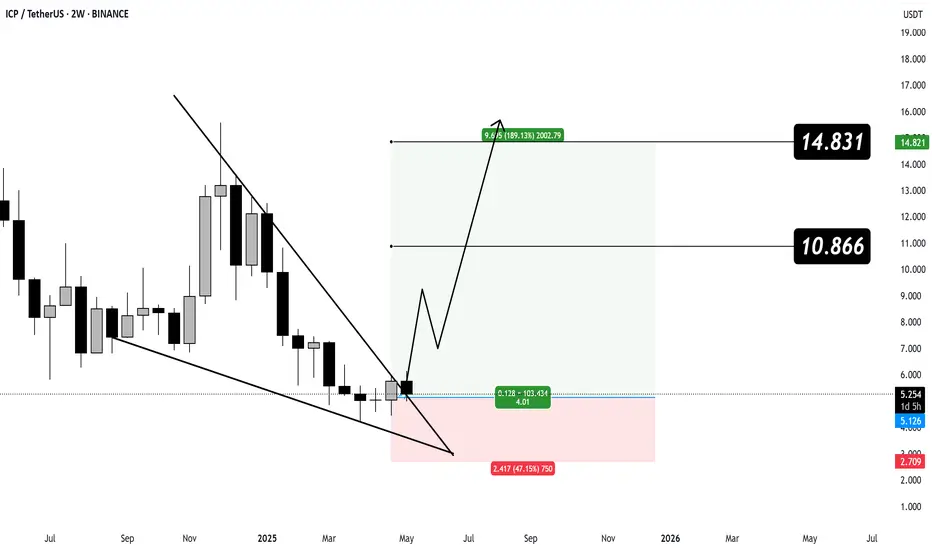
Pattern Identified: A Falling Wedge breakout to the upside — a classic bullish reversal pattern after a prolonged downtrend.
Breakout Confirmation: The breakout occurred near a key support level, increasing the reliability of the move.
Current Candle: Bullish candle above the wedge, confirming breakout strength.
🎯 Potential Price Targets:
First Target: $10.866
Second Target: $14.831
(Implying a potential upside of over +180% from current levels)
📉 Stop Loss:
Positioned at $2.709, below the previous low to invalidate the setup if breached.
✅ Conclusion:
ICP has broken out of a long-term falling wedge after months of correction. The breakout suggests a strong potential for a bullish rally towards the marked targets, as long as it holds above the support region.
Subscribe to my Telegram Channel 👉 :
t.me/addlist/y5mi70s3c0Y3MDQ0
Subscribe to my X 👉 : x.com/VIPROSETR
t.me/addlist/y5mi70s3c0Y3MDQ0
Subscribe to my X 👉 : x.com/VIPROSETR
Disclaimer
The information and publications are not meant to be, and do not constitute, financial, investment, trading, or other types of advice or recommendations supplied or endorsed by TradingView. Read more in the Terms of Use.