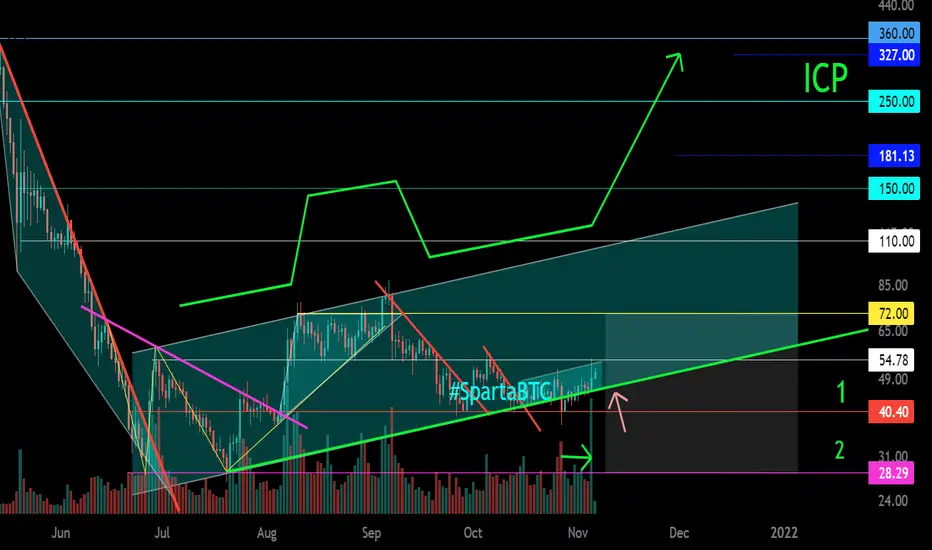
The main trend of this cryptocurrency. A squeeze zone along the trend. Again a large volume of the buyer came in the accumulation zone. Local momentum. Pullback. Zones of levels to work showed on the chart. Have your trading strategy and follow risk management in your trading.
Coinmarket: Internet Computer ICP
Coinmarket: Internet Computer ICP
Note
Note
Note
Note
Note
Note
Note
Note
Note
Note
Note
Note
Note
✅ Telegram. Finance + Trading: t.me/SpartaBTC_1318
✅ Telegram. Сrypto trading only: t.me/SpartaBTC_tradingview
✅ Instagram: instagram.com/spartabtc_1318
✅ YouTube (Rus): goo.su/vpRzRa2
✅ Telegram. Сrypto trading only: t.me/SpartaBTC_tradingview
✅ Instagram: instagram.com/spartabtc_1318
✅ YouTube (Rus): goo.su/vpRzRa2
Related publications
Disclaimer
The information and publications are not meant to be, and do not constitute, financial, investment, trading, or other types of advice or recommendations supplied or endorsed by TradingView. Read more in the Terms of Use.