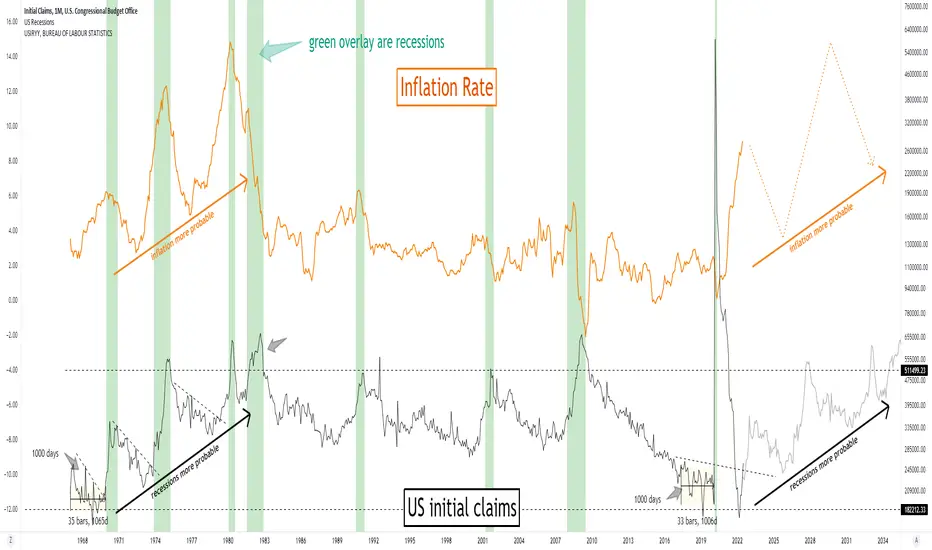
This chart has #stagflation written all over it.
If initial claims are back at 50 year lows. Seriously, do you think it's going down even more?
What did gold & silver do in the 1970s?
If initial claims are back at 50 year lows. Seriously, do you think it's going down even more?
What did gold & silver do in the 1970s?
✅Industry-leading technical analysis
✅Market commentary
✅Trade Tracker
✅Podcast Reviews
Use discount code "TRADINGVIEW" and get a lifetime 50% discount on PREMIUM plans
🔗northstarbadcharts.com/
✅Market commentary
✅Trade Tracker
✅Podcast Reviews
Use discount code "TRADINGVIEW" and get a lifetime 50% discount on PREMIUM plans
🔗northstarbadcharts.com/
Disclaimer
The information and publications are not meant to be, and do not constitute, financial, investment, trading, or other types of advice or recommendations supplied or endorsed by TradingView. Read more in the Terms of Use.