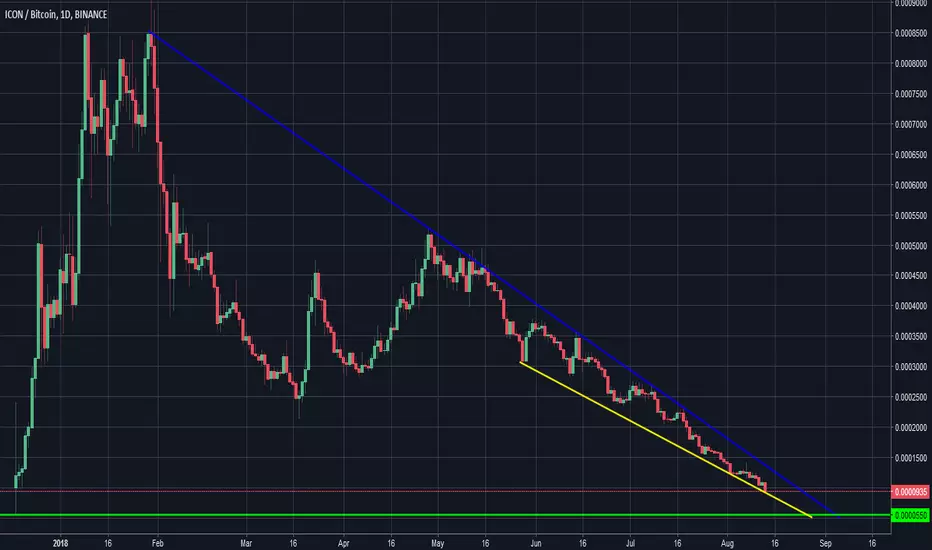
Green horizontal line is when the ICX/BTC pairing first hit binance. The blue trend line is a very serious point of resistance for ICX ever since it's peaking double top. The yellow line is recent support. Either which way it looks like ICX has to break one way or the other by early Septembre. It probably depends on BTC. Like most alt coins it remains a real wait and see. I think this one is gonna be one real dramatic dance either way.
Note
ICX did technically break bullish out of the trend line of resistance (it was almost certainly going to unless Icon zeros) it serves as an example that horizontal lines of support and resistance are of more relevance than trend lines.Disclaimer
The information and publications are not meant to be, and do not constitute, financial, investment, trading, or other types of advice or recommendations supplied or endorsed by TradingView. Read more in the Terms of Use.
Disclaimer
The information and publications are not meant to be, and do not constitute, financial, investment, trading, or other types of advice or recommendations supplied or endorsed by TradingView. Read more in the Terms of Use.