Hi All
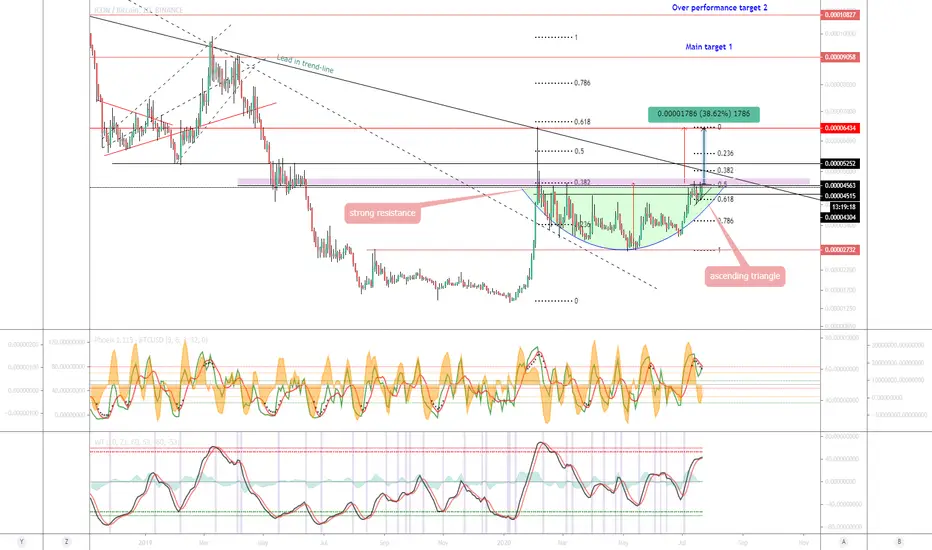
Just below the current strong resistance we have a ascending triangle.
Can it break through this without another pullback is the question and risk.
12 HRLY chart, close up

3Day chart, 13 hrs to go, bullish candle so far

MACRO overview

My thoughts:
Based on the RSI, I feel its going to spring up as its above 50% on the bounce, the bullish area and you can see the RSI reflecting the squeeze.
Tell you the truth, I don't know if it requires 1 more bounce in this small range.
With the 2 touches to the top and 2 touches to the bottom complete the ABCD formation with E in the middle.
I think it has a good chance breaking to the upside.
How to trade this?
I want to see how the 12 HRLY candle closes (1 hr left)
Cheers,
S.Sari
Just below the current strong resistance we have a ascending triangle.
Can it break through this without another pullback is the question and risk.
12 HRLY chart, close up
3Day chart, 13 hrs to go, bullish candle so far
MACRO overview
My thoughts:
Based on the RSI, I feel its going to spring up as its above 50% on the bounce, the bullish area and you can see the RSI reflecting the squeeze.
Tell you the truth, I don't know if it requires 1 more bounce in this small range.
With the 2 touches to the top and 2 touches to the bottom complete the ABCD formation with E in the middle.
I think it has a good chance breaking to the upside.
How to trade this?
I want to see how the 12 HRLY candle closes (1 hr left)
Cheers,
S.Sari
Note
still stalkingNote
Note
not holding, and potentially a handle now (Cup&Handle)Note
Still waiting for the level of the indicator to cross over on the 8hr, + a bullish candle stickDiscord: discord.com/invite/vb4hbP88vb (TradeToProspa)
Telegram: t.me/TprospaTradersbot
This community has signals now but with no risk management comms.
Telegram: t.me/TprospaTradersbot
This community has signals now but with no risk management comms.
Related publications
Disclaimer
The information and publications are not meant to be, and do not constitute, financial, investment, trading, or other types of advice or recommendations supplied or endorsed by TradingView. Read more in the Terms of Use.
Discord: discord.com/invite/vb4hbP88vb (TradeToProspa)
Telegram: t.me/TprospaTradersbot
This community has signals now but with no risk management comms.
Telegram: t.me/TprospaTradersbot
This community has signals now but with no risk management comms.
Related publications
Disclaimer
The information and publications are not meant to be, and do not constitute, financial, investment, trading, or other types of advice or recommendations supplied or endorsed by TradingView. Read more in the Terms of Use.