Hello Traders,
Hope you all enjoyed my 15% scalp ideas! That was just a quick cash, and I will probably be posting more of those in next few weeks.
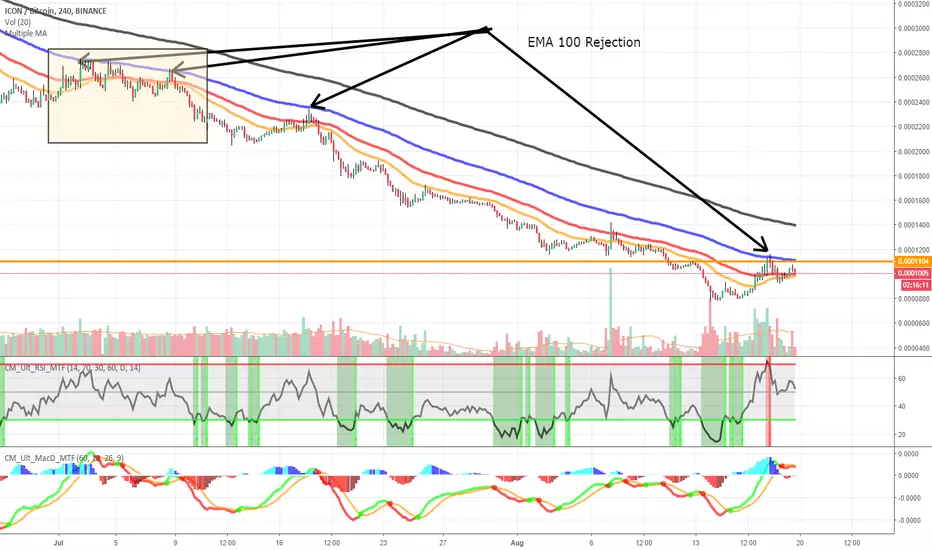
Looking at the long term, things are looking somewhat bright for Icon. If you have been trading Icon for more than 8 months, you probably noticed that MA 100 has been acting as the resistance for more than a month now, and we recently had rejection again.
However, things look a little bit different this time. You see, every time Icon was rejected by MA 100, it was unable to find support at MA 26 and MA 50. This time, however, Icon successfully found support around MA 26 and MA 200 level. To me, this is a very bullish sign and we will potentially see trend reversal very soon in long term.
Here is what I am looking at for bullish signals:
1) Go above MA 100: 1100 Satoshi is becoming a key level for both bulls and bears. I am 70% confident that bulls will try to test this level again and see how bears will react to it. Unfortunately, I think it will get rejected again and find support at MA 26 to build up more momentum. In next 48 hours, Icon needs to prove to me that 1000 Satoshi is a major support, or else I need to adjust my bullish view.
2) Volume: I know a lot of people do not look at volume when you trade, but let me tell you this tells you a lot of stories. You see, when Icon tested MA 50 and MA 100, we saw a spike in volume, which indicate that people are starting to get back to this community. After the MA 100 rejection, we are starting to see decline in volume. This usually indicate that people have entered long position, and they are not interested in selling. (unless you are swing trader like me) What I want to see now is further increase in volume (something like the volume on August 6th), in order to confirm the trend reversal.
If Icon manages to go above MA 100, I am looking to sell at MA 200, which is around 1300-1400 Satoshi (30% profit).
Happy trading!
Hope you all enjoyed my 15% scalp ideas! That was just a quick cash, and I will probably be posting more of those in next few weeks.
Looking at the long term, things are looking somewhat bright for Icon. If you have been trading Icon for more than 8 months, you probably noticed that MA 100 has been acting as the resistance for more than a month now, and we recently had rejection again.
However, things look a little bit different this time. You see, every time Icon was rejected by MA 100, it was unable to find support at MA 26 and MA 50. This time, however, Icon successfully found support around MA 26 and MA 200 level. To me, this is a very bullish sign and we will potentially see trend reversal very soon in long term.
Here is what I am looking at for bullish signals:
1) Go above MA 100: 1100 Satoshi is becoming a key level for both bulls and bears. I am 70% confident that bulls will try to test this level again and see how bears will react to it. Unfortunately, I think it will get rejected again and find support at MA 26 to build up more momentum. In next 48 hours, Icon needs to prove to me that 1000 Satoshi is a major support, or else I need to adjust my bullish view.
2) Volume: I know a lot of people do not look at volume when you trade, but let me tell you this tells you a lot of stories. You see, when Icon tested MA 50 and MA 100, we saw a spike in volume, which indicate that people are starting to get back to this community. After the MA 100 rejection, we are starting to see decline in volume. This usually indicate that people have entered long position, and they are not interested in selling. (unless you are swing trader like me) What I want to see now is further increase in volume (something like the volume on August 6th), in order to confirm the trend reversal.
If Icon manages to go above MA 100, I am looking to sell at MA 200, which is around 1300-1400 Satoshi (30% profit).
Happy trading!
Note
What are your opinions on the recent bull fake breakout?Are we seeing another bear fake breakout?
Note
ICON is officially above the MA 100 line!!! What I want to see now is to confirm MA100 as a solid support in order to have rally up to MA 200. I sold at 1100 Satoshi and planning on to get back in around 1070-1075. My mid-term target is 1250 Satoshi. Note
As expected, MA200 is acting as a resistance. However, I am convinced that there is a change in trend from bear to bull. There will be few days of side consolidation so that MA26 and MA50 can catch upDisclaimer
The information and publications are not meant to be, and do not constitute, financial, investment, trading, or other types of advice or recommendations supplied or endorsed by TradingView. Read more in the Terms of Use.
Disclaimer
The information and publications are not meant to be, and do not constitute, financial, investment, trading, or other types of advice or recommendations supplied or endorsed by TradingView. Read more in the Terms of Use.