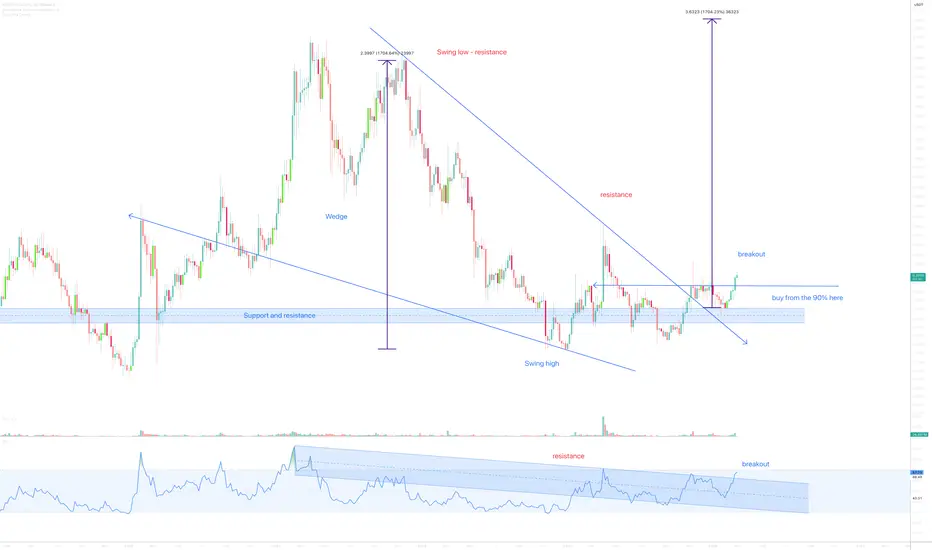
On the above 5-day chart price action has corrected 95%. A number of reasons now exist to be long, including:
1) Price action and RSI resistance breakouts.
2) Support confirms on past resistance (November 2019), look left.
3) The falling wedge allows us to forecast the cycle top as measured from the swing high to the swing low, 1700%.
Is it possible price action corrects further? Sure.
Is it probable? No. This is your call, we rise and we fall.
Ww
Type: Trade
Risk: <=6%
Entry: 21-29 cents if possible
Return: 1700%
Trade active
Past resistance confirms support.Note
GRM support confirms.Now you know what this means! Right?!
BTC
bc1q2eckdzh0q8vsd7swcc8et6ze7s99khhxyl7zwy
Weblink: patreon.com/withoutworries
Allow 3-6 months on ideas. Not investment advice. DYOR
bc1q2eckdzh0q8vsd7swcc8et6ze7s99khhxyl7zwy
Weblink: patreon.com/withoutworries
Allow 3-6 months on ideas. Not investment advice. DYOR
Disclaimer
The information and publications are not meant to be, and do not constitute, financial, investment, trading, or other types of advice or recommendations supplied or endorsed by TradingView. Read more in the Terms of Use.