Hi All,
Observations:
==========================================================
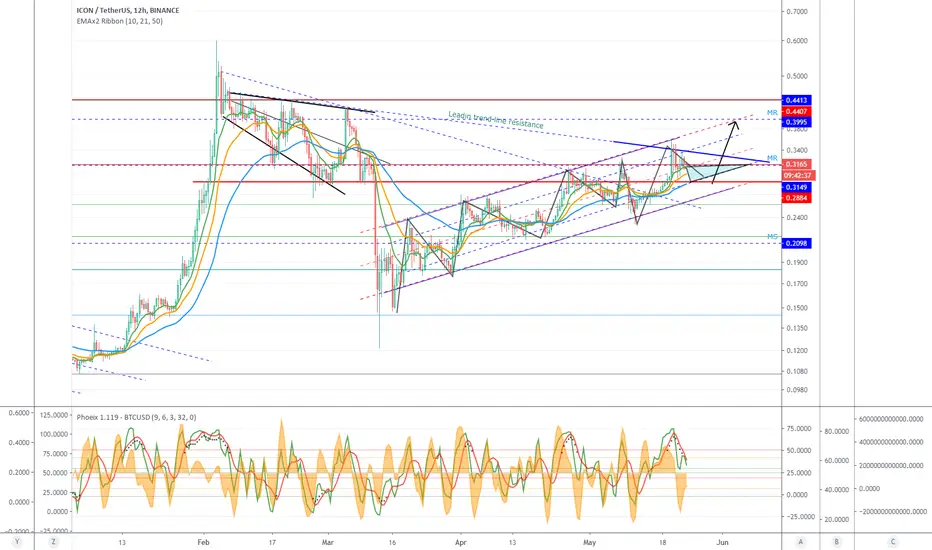
> ICON \ ICX shows a nice price action within a channel in a uptrend with higher highs and higher lows
> 1st rejection with the lead in trend line (resistance)
> The 10\20 and 50 ema have shown levels of support
> Bearish divergence has played out on the 12H as per this chart
> MR and MS are monthly resistance and support lines
Thoughts:
==========================================================
> BTC dominance is dropping
> 12 Hourly chart indicator shows downward pressure still their based on the RSI, also there on the daily chart
> Looking for confluence of price reversal at these moving average levels or fib levels in the channel
> So with this context, we can use the 10, 21, or 50 ema and or the levels in the channel, to look for setups for entry (in the 6 H, 12 H time frame, as per chart)
> Triangle area is my area of interest to enter (0.28 to 0.31)
Close up view > Area of interest 0.28 to 0.31

6 HRLY chart > downward pressure still there with bearish divergence in play

12 HRLY chart > downward pressure still there with bearish divergence in play

1 Day and above chart > MACD has bullish tone

Holistic overview > observe how the trend line is playing resistance and the 1st rejection.

Observations:
==========================================================
> ICON \ ICX shows a nice price action within a channel in a uptrend with higher highs and higher lows
> 1st rejection with the lead in trend line (resistance)
> The 10\20 and 50 ema have shown levels of support
> Bearish divergence has played out on the 12H as per this chart
> MR and MS are monthly resistance and support lines
Thoughts:
==========================================================
> BTC dominance is dropping
> 12 Hourly chart indicator shows downward pressure still their based on the RSI, also there on the daily chart
> Looking for confluence of price reversal at these moving average levels or fib levels in the channel
> So with this context, we can use the 10, 21, or 50 ema and or the levels in the channel, to look for setups for entry (in the 6 H, 12 H time frame, as per chart)
> Triangle area is my area of interest to enter (0.28 to 0.31)
Close up view > Area of interest 0.28 to 0.31
6 HRLY chart > downward pressure still there with bearish divergence in play
12 HRLY chart > downward pressure still there with bearish divergence in play
1 Day and above chart > MACD has bullish tone
Holistic overview > observe how the trend line is playing resistance and the 1st rejection.
Note
Note
That spike was short lived and I see more downward pressure on the 12 HRLY and below.Note
That level makes senseNote
Note
Reference: F.3-4.ChartNote
Note
Discord: discord.com/invite/vb4hbP88vb (TradeToProspa)
Telegram: t.me/TprospaTradersbot
This community has signals now but with no risk management comms.
Telegram: t.me/TprospaTradersbot
This community has signals now but with no risk management comms.
Disclaimer
The information and publications are not meant to be, and do not constitute, financial, investment, trading, or other types of advice or recommendations supplied or endorsed by TradingView. Read more in the Terms of Use.