Support and resistance levels:
The price action of the ICX coin is moving between the $0.60 support and $1 resistance levels. On the weekly time frame chart we have 3 more resistance levels working as major resistances after $1. These resistance levels will be $1.30, $2.30 and $3 is the final resistance as per the Binance exchange.

Oscillators:
On the weekly time frame, it can be seen that while the price action has found very strong support at $0.60, at the same time the stochastic has also entered the oversold zone and MACD is giving bullish signals by changing from a strong bearish to weak bearish.

Falling wedge:
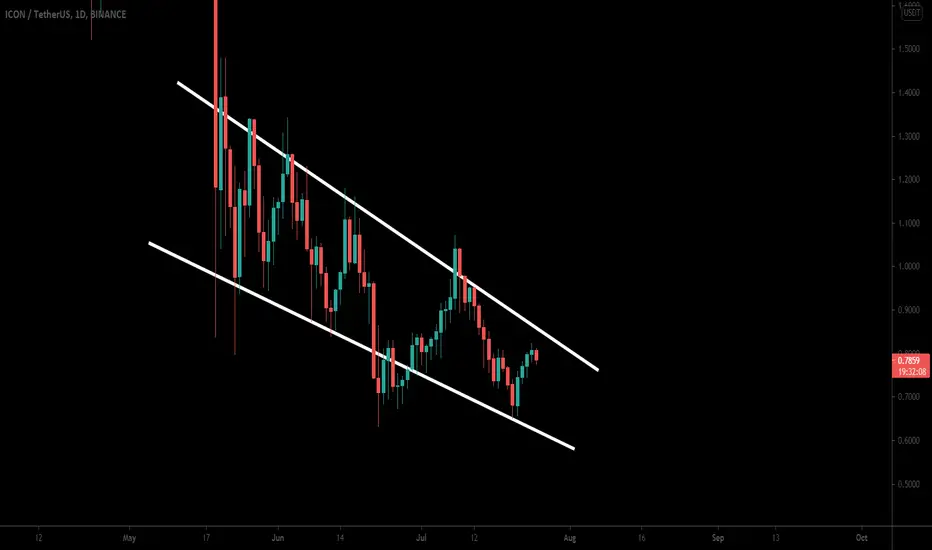
Previously we have seen that the price action of ICON was breaking out the resistance of a down channel. But it was failed to break out and moved back into the channel again. This time the support of the channel is lifted up. Therefore, the channel has been transformed to a falling wedge pattern and now the price action is again moving up to make another attempt to break out the resistance of this falling wedge pattern.

Big bullish BAT move:
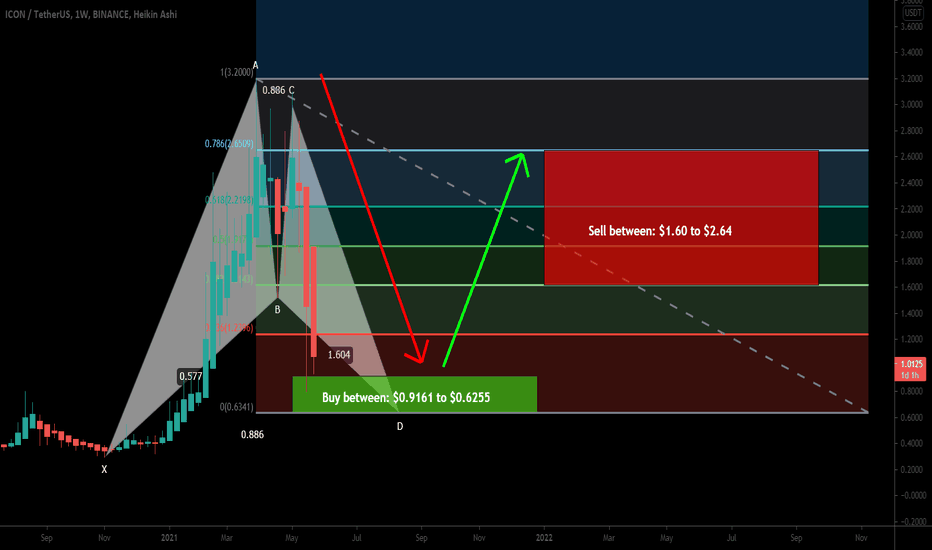
On the Weekly time period chart, the ICX has formed a bullish BAT.

As per the Fibonacci sequence of harmonic BAT the buy and sell targets of this pattern can be as below:
Buy between: $0.9161 to $0.6255
Sell between: $1.60 to $2.64
The maximum extent of buying zone can be used as a stop-loss, which is $0.6255. As per the above targets, this trade has a big profit possibility of 320% and the big loss possibility is 30%.
The price action of the ICX coin is moving between the $0.60 support and $1 resistance levels. On the weekly time frame chart we have 3 more resistance levels working as major resistances after $1. These resistance levels will be $1.30, $2.30 and $3 is the final resistance as per the Binance exchange.
Oscillators:
On the weekly time frame, it can be seen that while the price action has found very strong support at $0.60, at the same time the stochastic has also entered the oversold zone and MACD is giving bullish signals by changing from a strong bearish to weak bearish.
Falling wedge:
Previously we have seen that the price action of ICON was breaking out the resistance of a down channel. But it was failed to break out and moved back into the channel again. This time the support of the channel is lifted up. Therefore, the channel has been transformed to a falling wedge pattern and now the price action is again moving up to make another attempt to break out the resistance of this falling wedge pattern.
Big bullish BAT move:
On the Weekly time period chart, the ICX has formed a bullish BAT.

As per the Fibonacci sequence of harmonic BAT the buy and sell targets of this pattern can be as below:
Buy between: $0.9161 to $0.6255
Sell between: $1.60 to $2.64
The maximum extent of buying zone can be used as a stop-loss, which is $0.6255. As per the above targets, this trade has a big profit possibility of 320% and the big loss possibility is 30%.
Disclaimer
The information and publications are not meant to be, and do not constitute, financial, investment, trading, or other types of advice or recommendations supplied or endorsed by TradingView. Read more in the Terms of Use.
Disclaimer
The information and publications are not meant to be, and do not constitute, financial, investment, trading, or other types of advice or recommendations supplied or endorsed by TradingView. Read more in the Terms of Use.
