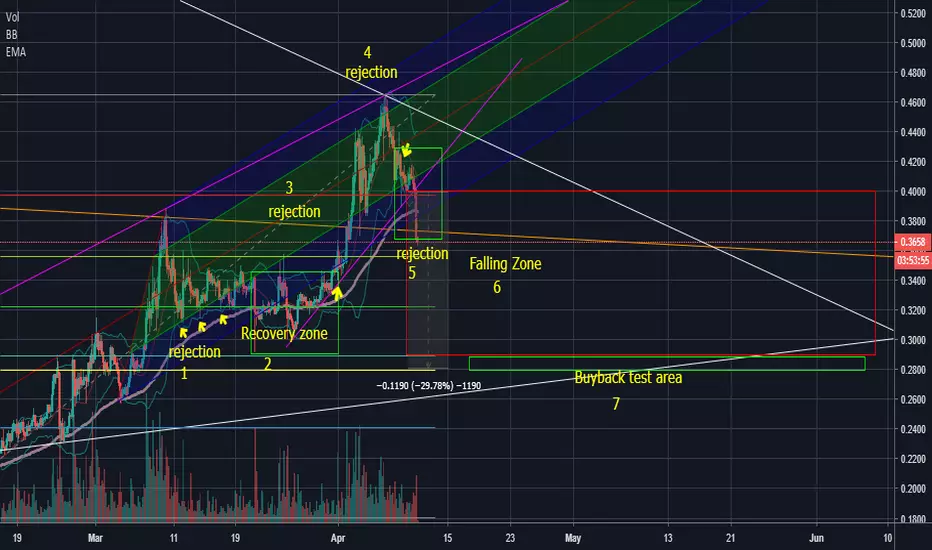
ICX has been in an upward channel these past few weeks and with BTC breakout helped extend this move. As we broke down out of our channel and our fork tonight this is where we stand and our targets ahead.
Everything here is what I see. This is never financial advice trade wise.
Everything here is what I see. This is never financial advice trade wise.
Note
So Rejection (1) to start we showed solid support in the lower mid area (green zone under our midline (red line)). Notice how we kept bouncing off this area but, the midline kept pushing us back down. we broke it on the first push we wicked out but, retested it on our second yellow arrow but, failed to reach our Midline again and finally once more bounce on our lower mid. Rejection(3) zone after we went to our baseline( lower Blue zone) we glided against this and made an attempt move up but, were pushed back down from our Lower mid (green zone) and pushed out of even our pitch fork.
Note
Next, we have Recovery zone(2) (Green boxed zone) This is where we fell out of our pitchfork but, we eventually pushed to get back into our pitchfork. next, we pushed into our base area (blue) Broke our lower mid and our midline(Red line) But, couldn't break into our High zone (blue zone above our midline). so we fell bounce on our Lower area to retest it we made it but, barely rejected wick us down which made us drop drastically from higher zone to our base area and currently a falling knife out of our pitchfork which is rejection (5).
Note
Our red boxed area is where I see us falling to next. our two pink lines are our channel in which we were in but, broke down the 29% is from the width of that and our fib lines up with that zone from the break the area of 0.2890--0.2799 points to a strong buy signal and it matches to the exact width of our channel.Note
This is our big picture the white lines are the main channel we have been in for months and the 2nd white line is our recent support area we broke it at one point but, it's still a line we regained in time.Note
this green box near our white line support is where I see it bouncing if anywhere which aligns with our channel width (pink lines) and our 0.65 rough area to 6.18Note
as always wait and see this should be a few days to weeks depending on how BTC reacts here.Note
expect a flag to form here and bring us down another legNote
small picture update 0.29 still areas to wait forNote
week needs volume in 24 hours or down wick closing ahead to go towards the targets we wantNote
bounce hit orders should have been filled if you followed our buyback area targeting 3100-3300-3500 for now but taking profits as we continue to move.Note
10% in profits so far if you followed. 100 ema showing as a resistance line (orange line) laddering some sells to be in profit here incase BTC wants to turn. closing for now since this was a down move waiting play but will still update later in 12 hours .Note
Selling 90% I have here most was near 100 ema but average profited 12% patience for the 618 always pays off happy trading . Also it could still go up to 3600-3800 region but letting the last 10% I have play til I get stopped near 3k since I’m in heavy profit happy trading allNote
supper old support line (orange test v2)Trade closed: target reached
Disclaimer
The information and publications are not meant to be, and do not constitute, financial, investment, trading, or other types of advice or recommendations supplied or endorsed by TradingView. Read more in the Terms of Use.
Disclaimer
The information and publications are not meant to be, and do not constitute, financial, investment, trading, or other types of advice or recommendations supplied or endorsed by TradingView. Read more in the Terms of Use.
