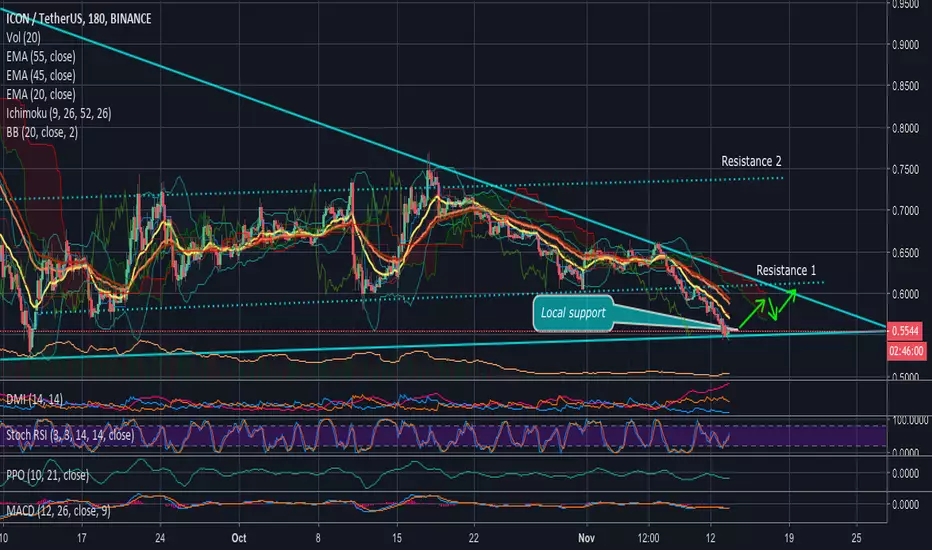
At the 3-hours timeframe chart we can see a nice short term trade opportunity.
The price of ICX hit the bottom BB channel edge as well as the bottom edge of the triangle. As the volume grew and the price bounced we can conclude that the support level holds. It means the price should perform a wave movement pattern till the upper edge of the triangle.
Indicators become bullish again. According DMI a sharp rise is possible in the short term
Reverse points for swing trading strategy are presented as targets in the signal in the Premium channel. The last target is valid only in case of breakout, do not place delayed orders now. We will provide you with an update in case 4th target is in action.
Note
This night the price broke down the thriangle and went down. DMI shows a possibility of a sharp movement, it can be an uptrend as well as a downtrend. Indicators are now bullish and volume grows as we forecasted however it doesn’t mean you should buy the coin. The price can perform small bounces but overall it goes to the lover support level around 0.450
Loss: 2.7%
Duration: 1 Day
Claim up to 600 USDT in welcome rewards & compete for a share of 5,000 USDT in BitMart Futures Contest!
➡ Register & Claim Bonus: bitmart.com/invite/VShg8M
➡ Join Contest: bitmart.com/futures-competition/Skyrexio/en-US
➡ Register & Claim Bonus: bitmart.com/invite/VShg8M
➡ Join Contest: bitmart.com/futures-competition/Skyrexio/en-US
Disclaimer
The information and publications are not meant to be, and do not constitute, financial, investment, trading, or other types of advice or recommendations supplied or endorsed by TradingView. Read more in the Terms of Use.