hi traders
I'm very bullish on ICXUSDT.
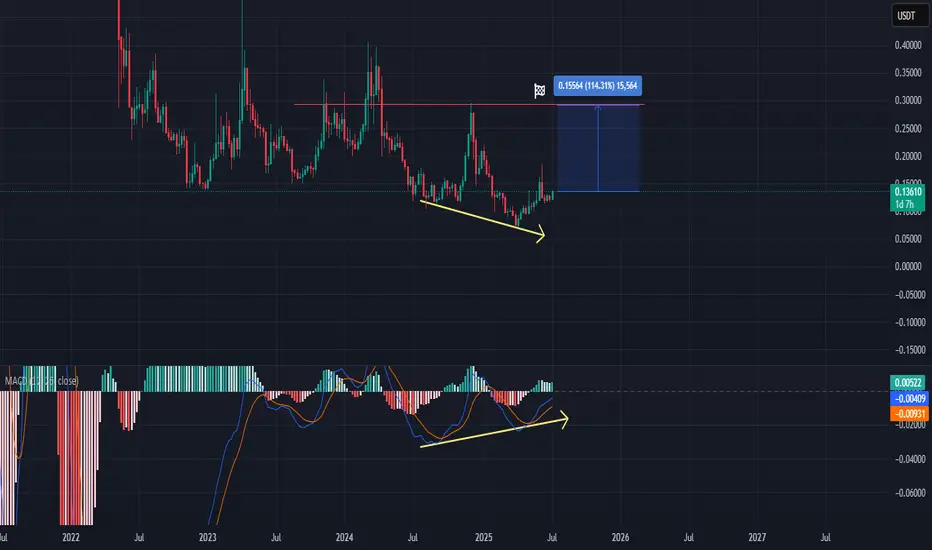
The chart displays a bullish divergence between the price and the MACD indicator. The price (top panel) has made lower lows (yellow downward arrow), while the MACD (bottom panel) has made higher lows (yellow upward arrow), indicating weakening bearish momentum and potential for a reversal.
Entry: Current price around $0.1358. Consider entering long at current levels or on a confirmed breakout from consolidation.
Target: The blue box indicates a target zone around $0.28-$0.30, which represents a potential 114.31% increase and aligns with previous resistance.
Rationale: The bullish divergence suggests that the selling pressure is waning, and a move higher is probable, aiming for the key resistance level.
I'm very bullish on ICXUSDT.
The chart displays a bullish divergence between the price and the MACD indicator. The price (top panel) has made lower lows (yellow downward arrow), while the MACD (bottom panel) has made higher lows (yellow upward arrow), indicating weakening bearish momentum and potential for a reversal.
Entry: Current price around $0.1358. Consider entering long at current levels or on a confirmed breakout from consolidation.
Target: The blue box indicates a target zone around $0.28-$0.30, which represents a potential 114.31% increase and aligns with previous resistance.
Rationale: The bullish divergence suggests that the selling pressure is waning, and a move higher is probable, aiming for the key resistance level.
💥 Free signals and ideas ➡ t.me/vfinvestment
Disclaimer
The information and publications are not meant to be, and do not constitute, financial, investment, trading, or other types of advice or recommendations supplied or endorsed by TradingView. Read more in the Terms of Use.
💥 Free signals and ideas ➡ t.me/vfinvestment
Disclaimer
The information and publications are not meant to be, and do not constitute, financial, investment, trading, or other types of advice or recommendations supplied or endorsed by TradingView. Read more in the Terms of Use.