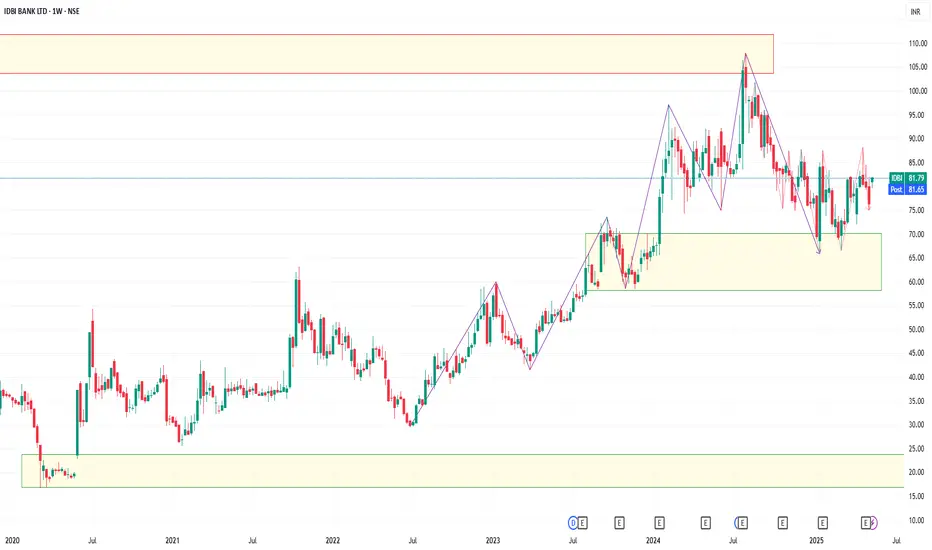
In this analysis, we are focusing on Price Action and using pullback trading as our method of trading.
Based on our trading methodology, the price has recently pulled back into the demand zone in the monthly chart, with a target of 105. The weekly chart has been in an uptrend, but recently has signaled a trend reversal. However, as a monthly zone is considered stronger than the weekly chart, we can expect the weekly chart to continue its uptrend and move towards a target of 105.
I am not SEBI registered. The information provided here is for learning purposes only and should not be interpreted as financial advice. Consider the broader market context and consult with a qualified financial advisor before making investment decisions.
Disclaimer
The information and publications are not meant to be, and do not constitute, financial, investment, trading, or other types of advice or recommendations supplied or endorsed by TradingView. Read more in the Terms of Use.
Disclaimer
The information and publications are not meant to be, and do not constitute, financial, investment, trading, or other types of advice or recommendations supplied or endorsed by TradingView. Read more in the Terms of Use.