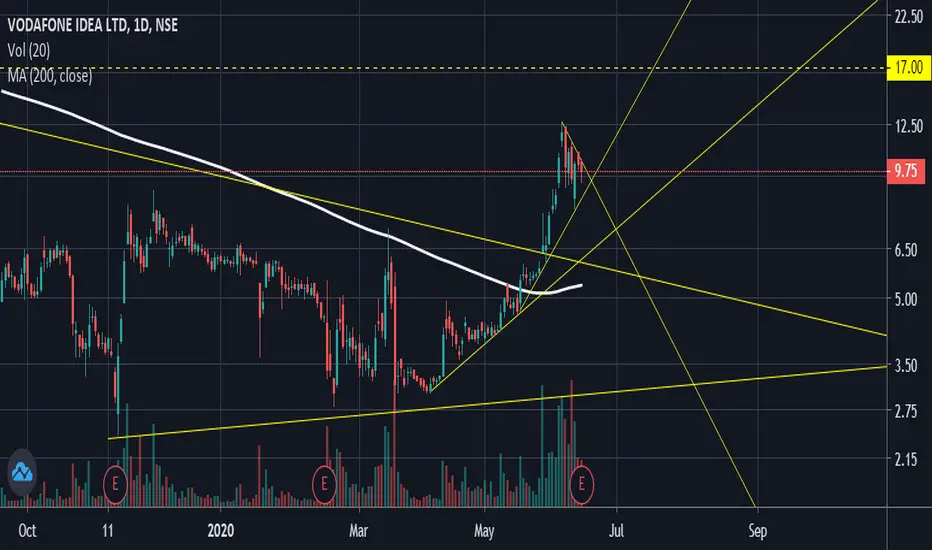
Why GooseBumps Bullish ???
1. In 1 day chart stock is above 200 Moving Average.
2. Stock has broken its bigger triangle Pattern.
3. In Its small recent triangle Pattern, stock is in over bought zone in RSI.
4. If in small recent triangle its breakout than its confirm the reversal.
1. In 1 day chart stock is above 200 Moving Average.
2. Stock has broken its bigger triangle Pattern.
3. In Its small recent triangle Pattern, stock is in over bought zone in RSI.
4. If in small recent triangle its breakout than its confirm the reversal.
Trade active
Stock is now trading at 11rs above.Disclaimer
The information and publications are not meant to be, and do not constitute, financial, investment, trading, or other types of advice or recommendations supplied or endorsed by TradingView. Read more in the Terms of Use.
Disclaimer
The information and publications are not meant to be, and do not constitute, financial, investment, trading, or other types of advice or recommendations supplied or endorsed by TradingView. Read more in the Terms of Use.