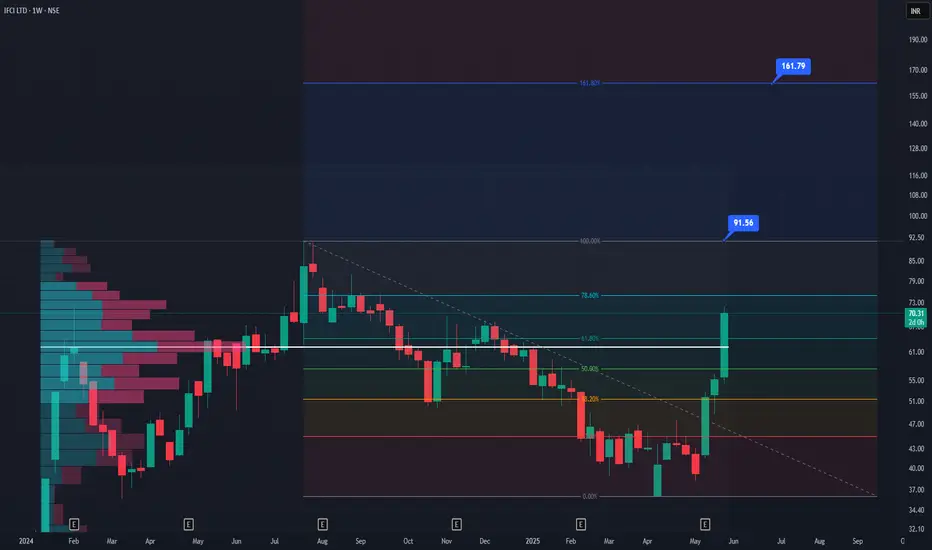
Technical Setup – IFCI Ltd. on the weekly timeframe chart
📊 Fundamental Story – Government owned NBFC
Focused on infrastructure and industrial finance
Recent market rally shows renewed investor interest
Benefits from:
• PSU sector momentum
• Government capex push
• Improved asset quality & restructuring progress
Turnaround story in the making, driven by fundamentals + reform
Like, comment your thoughts, and share this post!
Explore more stock ideas on the right hand side your feedback means a lot to me!
Disclaimer: This post is for educational purposes only and should not be considered a buy/sell recommendation.
- Current Price: ₹70.31
- Breakout Confirmation: Price broke above major trendline resistance (dotted line) with strong volume
- Volume Profile: Highest traded zone was around ₹42–₹50 (base built here)
- Fibonacci Levels: 61.8% broken = bullish signal
- Targets: 🎯 ₹91.56 (100% Fib level) 🎯 ₹161.79 (161.8% extended Fib target – long term)
📊 Fundamental Story – Government owned NBFC
Focused on infrastructure and industrial finance
Recent market rally shows renewed investor interest
Benefits from:
• PSU sector momentum
• Government capex push
• Improved asset quality & restructuring progress
Turnaround story in the making, driven by fundamentals + reform
Like, comment your thoughts, and share this post!
Explore more stock ideas on the right hand side your feedback means a lot to me!
Disclaimer: This post is for educational purposes only and should not be considered a buy/sell recommendation.
LOW RISK? PLAY HUGE!
Follow for latest updates and valuable financial content
✆ t.me/iVishalPal
Yt: t.ly/frb4G
LinkedIn: t.ly/g_SjB
WhatsApp: t.ly/_6T9j
TradingView: t.ly/-UGgZ
Telegram: t.me/traderpulseyt
Follow for latest updates and valuable financial content
✆ t.me/iVishalPal
Yt: t.ly/frb4G
LinkedIn: t.ly/g_SjB
WhatsApp: t.ly/_6T9j
TradingView: t.ly/-UGgZ
Telegram: t.me/traderpulseyt
Related publications
Disclaimer
The information and publications are not meant to be, and do not constitute, financial, investment, trading, or other types of advice or recommendations supplied or endorsed by TradingView. Read more in the Terms of Use.